


Sustainable Aviation Fuel CIF ARA
/ COMMODITIES
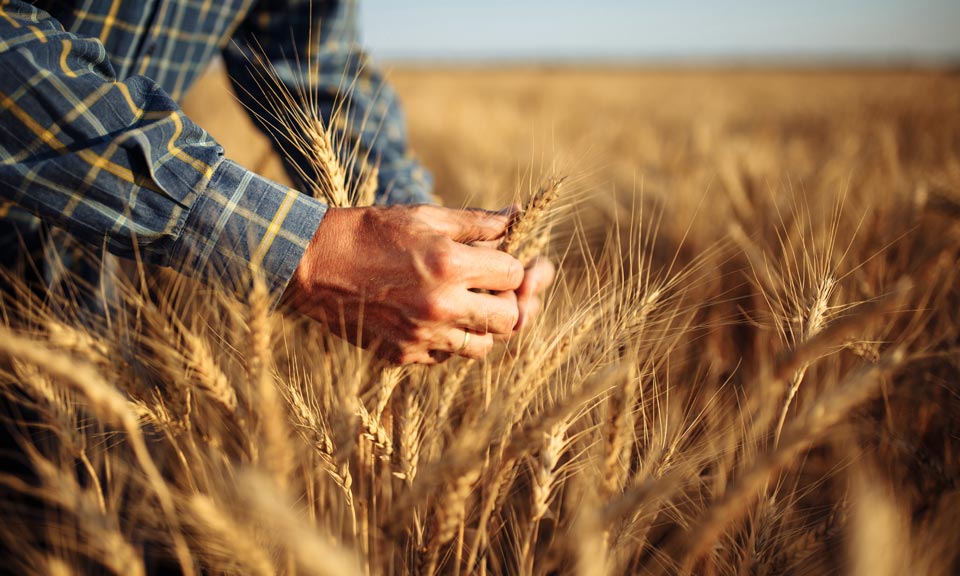
Interactive: A Pathway to New Farm Bill
What's causing lawmakers a delay in agreeing a Farm Bill?
/ COMMODITIES

/ COMMODITIES
What's causing lawmakers a delay in agreeing a Farm Bill?
/ COMMODITIES

The process of putting together a new farm bill continues to churn in Washington, but progress has not yet reached a point where lawmakers can get down to writing the details of the legislation at the committee level, let alone to have the full House and Senate act on the measure. And the longer this process drags out, it is affecting the odds a bill will be able to be finished yet this year.Join Roger Bernard, Senior Policy Analyst and Richard Morrison, Writer/Editor,SP Global Commodity Insights as they share the outlook on the progress of the new farm bill.
The global dairy dynamic continues to shift and face challenges into 2024. Production and demand continue to send mixed messages across the supply chain. Join Ryan UrieGlobal Head of Meat and Livestock and Sarah Reid Lead Analyst of Meat and Livestock – EMEA as they discuss the current landscape and what to expect from global prices going forward.Get access to the latest Global Dairy Report here

While consumers have complained of rising chocolate Easter egg prices in recent weeks (or even shrinkflation), this is likely only the beginning as futures prices have rallied considerably in recent weeks and show no signs of backing off amid a grim supply outlook. SPGCI analysts also discuss wet planting conditions in many Northern Hemisphere countries and El Nino-affected harvests in the Southern Hemisphere in this month’s video.KNOW MORE
Join Joe SomersConsulting Director Agribusiness S P Global Commodity Insights as he explores what are the farms of the future? It is critical to have detailed knowledge of farm structure, performance and demographics of the farm sector to better assess which segments will continue to thrive or thrive best and the needs of different types of producers that will dictate the future landscape. Joe dives into the recent U.S census data to look for trends and key indicators of what the future could hold and how the farming industry has evolved over the last 20 years. Take a listen now!

Listen now as, Wesley MonteiroGlobal LeadStrategic Engagement Intelligence GroupSP Global Commodity Insights sheds light on the sugar outlook, supply and demand, as well as risk factors for the next planting season.Watch now to get learn all about the key topics from the Geneva Sugar Conference 2024Want more? Watch as Stefan Uhlenbrock gives his views on the event’s key takeaways and what to look out for in the upcoming 24-25 season! Click here to view.
Listen now as Stefan UhlenbrockAssociate DirectorSP Global Commodity Insights sheds light on the sugar outlook from the biggest marketsBrazilIndia and Thailand including on where the prices might head.Watch now to learn all about the key topics from the Geneva Sugar Conference 2024Want more? Watch as Wesley MonteiroGlobal LeadStrategic Engagement Intelligence Group, gives his views on the event’s key takeaways and what to look out for in the upcoming 24-25 season! Click here to view.
Join Stephen LiResearch DirectorBiofuelsS P Global Commodity Insights as they divlge the capabilities within the bio-naphtha sector.CERAWeek is taking place from March 18-22 and LIVE will be your all-access pass to the conference. Check back for more insights and cutting-edge coverage.
Listen to Gajendra KumarDirector Process Economics Program at SP Global Commodity Insights, coming straight from the World Petrochemical ConferenceWPC) in HoustonTXUSA. Gajendra highlights the discussion centering production of sustainable transportation fuels harnessing carbon dioxide and the industry's outlook on investment in alternative fuels. WPC is taking place from March 18-22 and LIVE will be your all-access pass to the conference. Check back for more chemical insights and cutting-edge coverage.

The role of biofuels in energy transition is growing, as they can help decarbonize hard-to-abate transport sectors, but more supply is needed to keep the world on track with net-zero goals. S&P Global Commodity Insights explores how regional policies are driving adoption and evolving technology is widening the feedstock pool, as well as supply and demand outlooks across transport sectors. READ MORE

Ellie MaruyamaPrincipal Consultant with SP Global Commodity Insights Downstream and Refining Advisory Team, and Lingqi LouConsultant with SP Global Commodity Insights Agribusiness Advisory Team, discuss what we will be looking for in the upcoming release of a modified GREET model, which will be designed to calculate emission reductions of Sustainable Aviation FuelSAF) under the Inflation Reduction ActIRA). This development will have implications for the United States’ ability to achieve ambitious SAF targets.

The ethanol industry is angling to be a bigger part of the US decarbonization strategy, but so far, the Biden administration has sent some mixed signals on the issue. For instance, the Treasury Department has made some policy decisions that could provide some big opportunities for ethanol, but the Environmental Protection Agency is slow walking other policies the industry has called for.Brian Jennings, CEO of the American Coalition for Ethanol, joins the podcast to discuss the administration’s recent policy decisions, and outline additional actions the industry is seeking.Stick around after the interview for Jeff Mower with the Market Minute, a near-term look at oil market drivers.Related content:US Treasury allows GREET model for SAF credit, opening opportunity for ethanol (subscriber content)EPA looks to issue E15 rule in March; biofuel groups want swifter action(subscriber content)
Listen to Georgy EliseevLead Research Analyst at SP Global Commodity Insights, coming straight from the World Petrochemical ConferenceWPC) in HoustonTXUSA. Georgy brings to you all-things ammonia and its potential as a fuel within the energy transition dynamics. WPC is taking place from March 18-22 and LIVE will be your all-access pass to the conference. Check back for more chemical insights and cutting-edge coverage.

Login
Sustainable Aviation Fuel CIF ARA
What is Sustainable Aviation Fuel CIF ARA?
The assessment reflects neat SAF produced via the Hydrotreated Esters and Fatty Acid (HEFA) pathway from Renewable Energy Directive-compliant feedstocks, with an exclusion for Palm Fatty Acid Distillate, and reflects minimum GHG savings of 80%. Other GHG savings levels will be considered but may be normalized to the minimum basis level. The assessment>reflects product that holds proof of sustainability obtained in the framework of voluntary schemes approved by the EU Commission. Market participants shall exercise reasonable efforts to provide all necessary documentation for Proof of Sustainabilitydocumentation.
Discover
When the competition is fast, you need to be faster. We're giving you access to the latest cross-commodity insight, ET intelligence and market-leading views, so you can stay on the pulse.