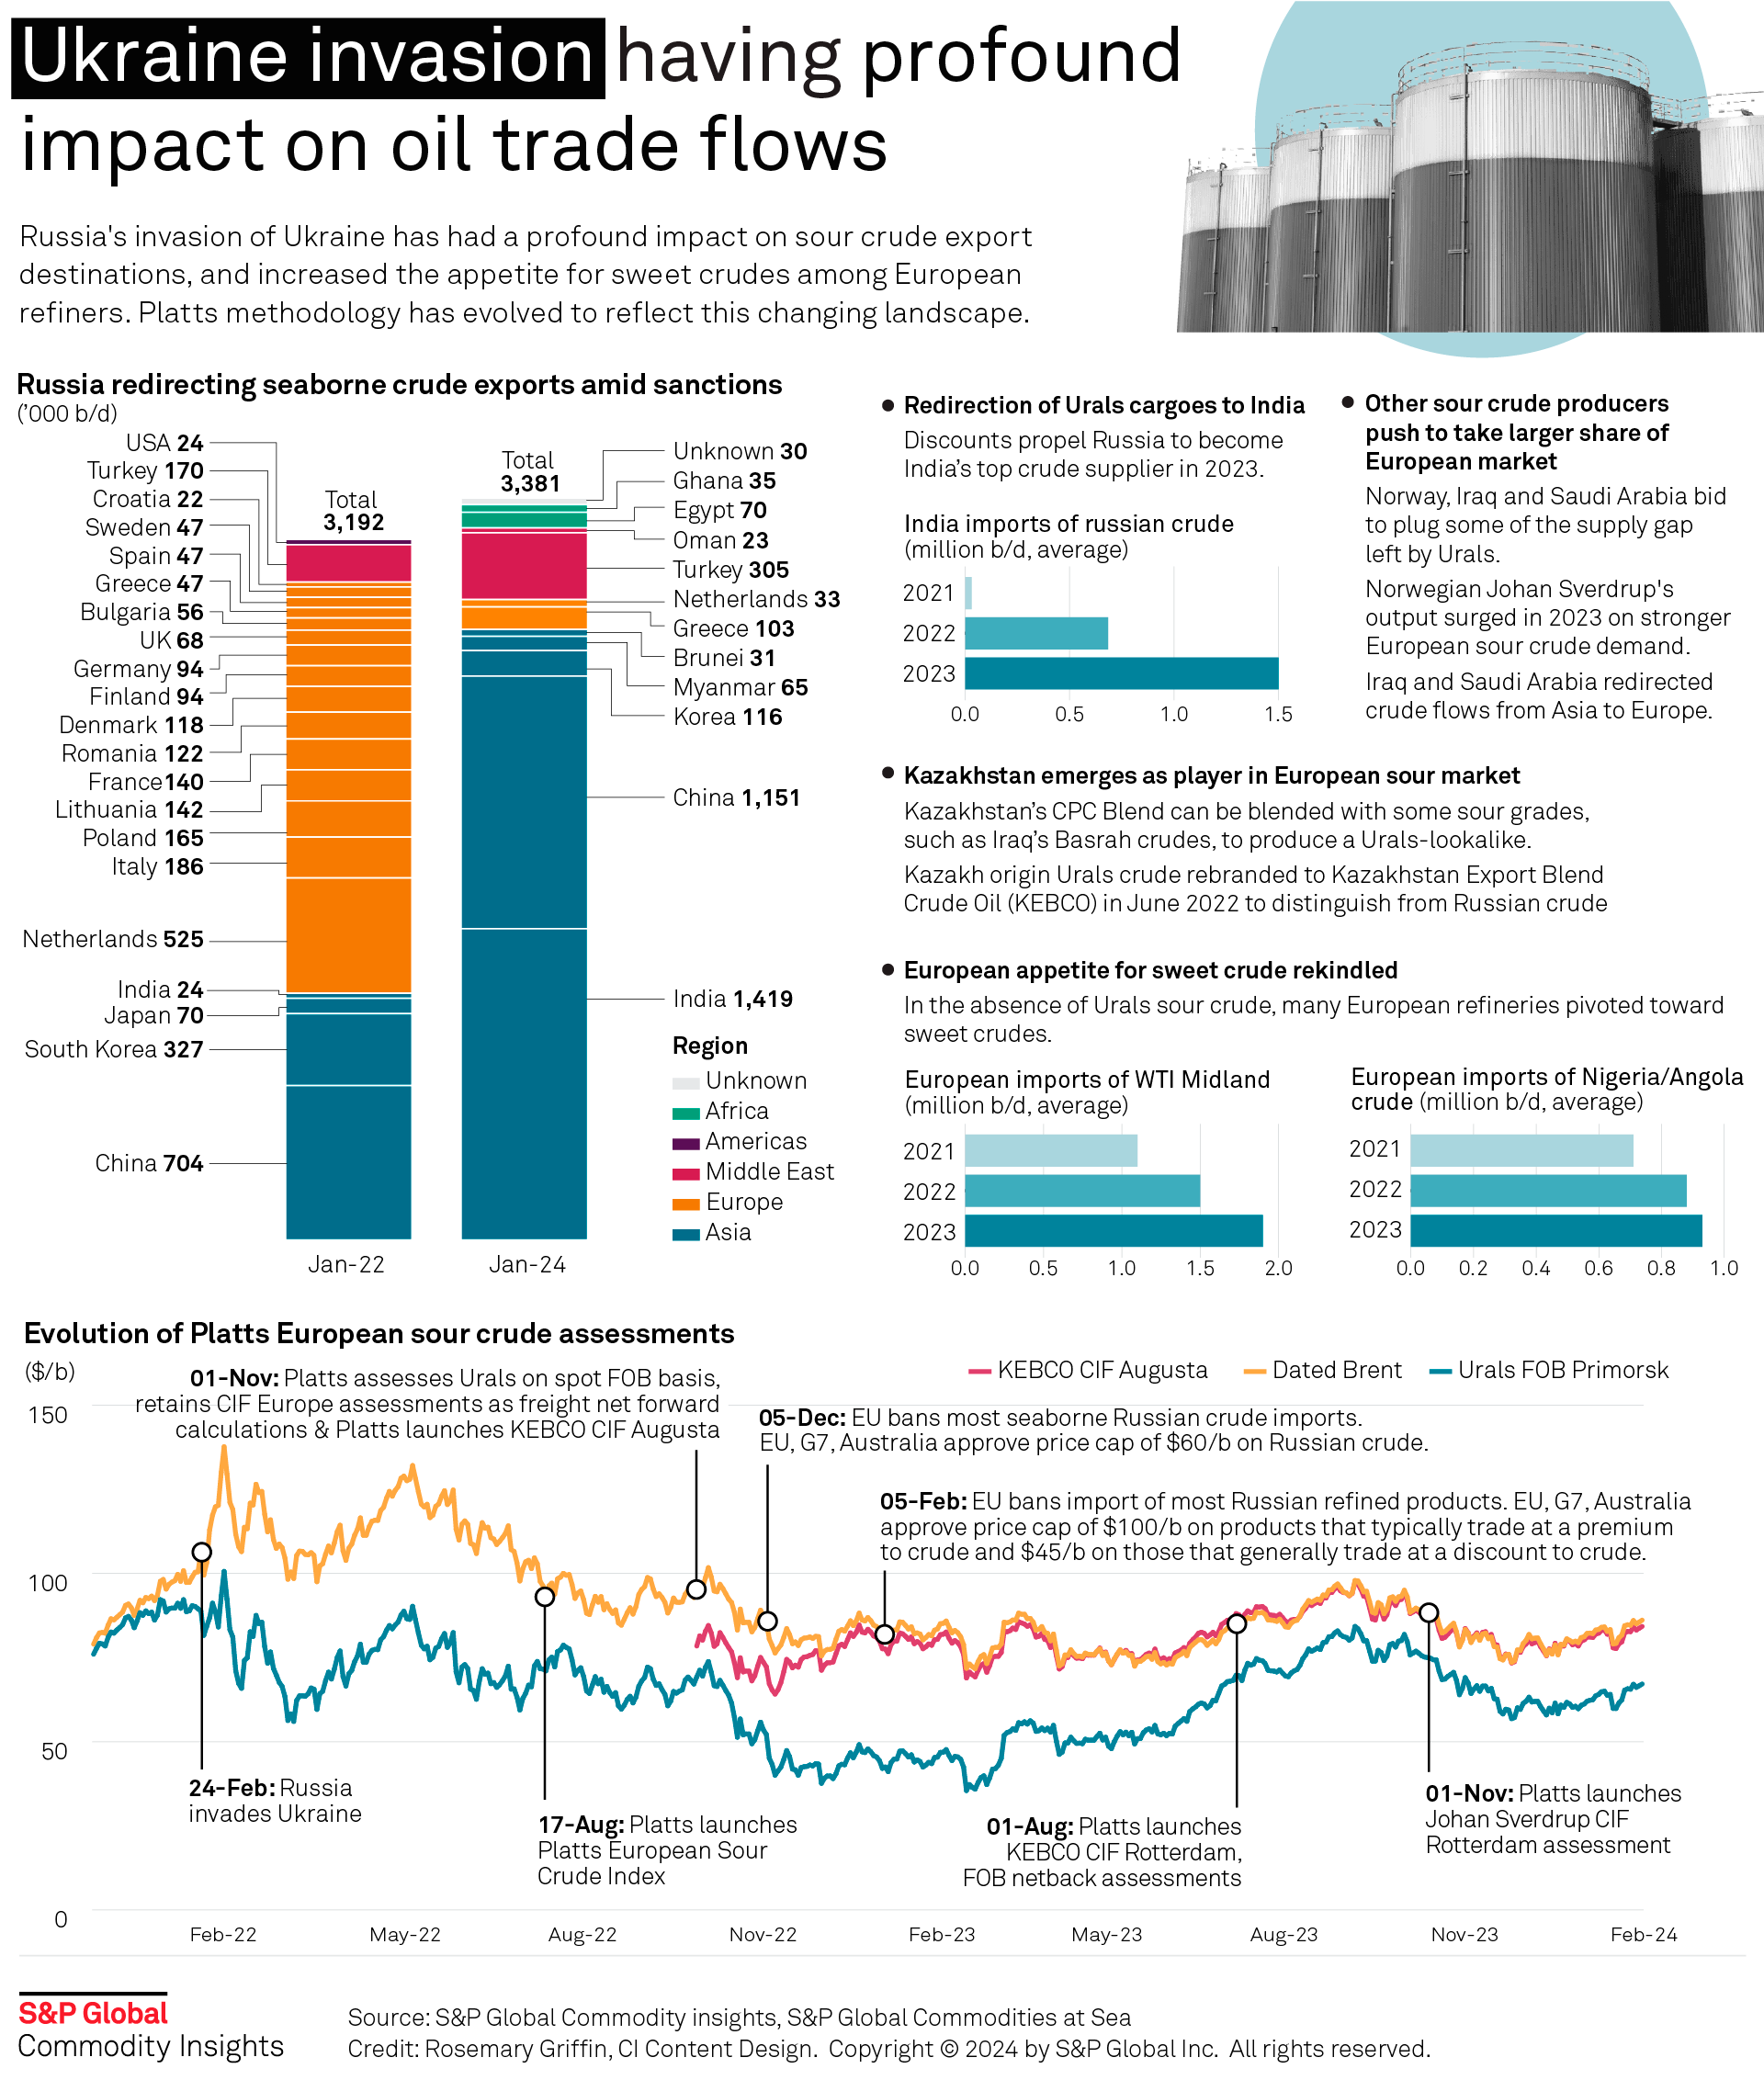
Infographic: Ukraine invasion having profound impact on oil trade flows
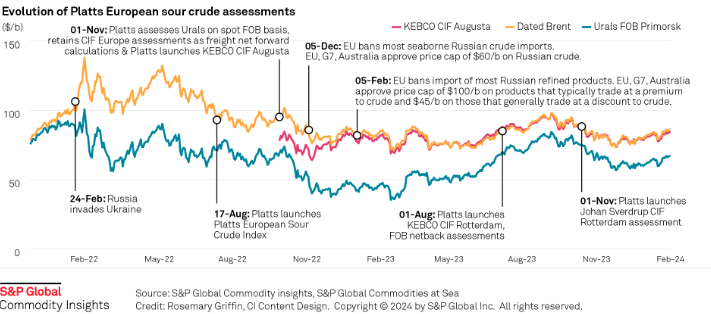
Russia's invasion of Ukraine has had a profound impact on sour crude export destinations, and increased the appetite for sweet crudes among European refiners.
Platts methodology has evolved to reflect this changing landscape.
Click here to see the full-size infographic.
News
India's unwavering appetite for Russian crude has provided ample bandwidth to Middle Eastern sour crude suppliers to cater to the needs of South Korea, Japan, Thailand and other East Asian buyers. Even if OPEC+ decides to extend production cuts, East Asian refiners are confident they can secure adequate Middle East sour crude term supplies. View full-size infographic Also listen:

News
Latest update: Jan. 30, 2024 A key OPEC+ advisory committee, co-chaired by Saudi Arabia and Russia, is set to meet online Feb. 1, with crude prices still stuck below the level that many of the alliance’s major producers need to balance their budgets. Traders will be seeking signals from the Joint Ministerial Monitoring Committee meeting on how long the bloc will keep the reins on its production and how it sees supply-demand fundamentals shaping up in the months ahead. Related story: OPEC+ monitoring committee prepares to meet as group battles sticky oil prices (Subscriber content) Click here to view the full-size infographic Compare hundreds of different crude grades and varieties produced around the world with Platts interactive Periodic Table of Oil .

News
Sumas spot gas down 90.6% year on year CAISO solar generation up 6 points in Dec US West power forwards are trending roughly 50% lower than year-ago packages on weaker gas forwards and above-normal temperatures forecast with El Nino weather conditions to linger into spring. El Nino conditions, which typically occur January through March, tend to bring more rain to the US Southwest and warmer-than-normal temperatures. The three-month outlook indicates a greater probability for above-normal temperatures across most of the Western US, with the exception of the Desert Southwest, according to the US National Weather Service's Climate Prediction Center. SP15 on-peak January rolled off the curve at $55.75/MWh, 79.4% lower than where the 2023 package ended, according to data from Platts, part of S&P Global Commodity Insights. The February package is currently in the low 50s/MWh, 70% below where its 2023 counterpart was a year earlier, while the March package is in the mid-$30s/MWh, 55.4% lower. In gas forwards, SoCal January rolled off the curve at $3.779/MMBtu, 97.9% below where the 2023 contract ended a year earlier, according to S&P Global data. The February contract is currently around $4.063/MMBtu, 78.9% lower than its 2023 counterpart at the same time last year, while the March contract is about $2.816/MMBtu, 63.2% lower. Gas plants burned an average of 1.815 Bcf/d in December to generate an average of 267.167 GWh/d, an analysis of S&P Global data showed. That's down 0.66% from November and a drop of 11.2 % from 2023. S&P Global forecast CAISO's gas fleet to generate around 220 GWh/d in February. In comparison, burning fuel at the same rate as February 2023 would consume 1.758 Bcf/d, a 6% decrease year on year. Spot markets In spot markets, power prices were down significantly from a year ago, when cold weather hit the region and drove up prices. SP15 on-peak day-ahead locational marginal prices averaged $43.49/MWh in December, 83% lower year over year and 11.2% below November prices, according to California Independent System Operator data. Helping pull down power prices, spot gas at SoCal city-gate was down 88.4% year on year and 40% lower month on month at an average of $3.554/MMBtu in December, according to S&P Global data. In the Northwest, Sumas spot gas was down 90.6% year on year at an average of $2.669/MMBtu. The decline in spot gas prices likely accounts for the lower average spot power prices month on month in December, said Morris Greenberg, senior manager with the low-carbon electricity team at S&P Global. Compared to a year earlier, CAISO population-weighted temperatures averaged 8% higher in December, resulting in 38.4% fewer heating-degree days, according to CustomWeather data. Fuel mix Thermal generation remained the lead fuel source at 46.1% of the total fuel mix in December, little changed year on year, while solar generation was up nearly 6 percentage points to average 14.7% of the mix, according to CAISO data. Hydropower remained strong, averaging 8% of the December fuel mix, 2 points higher than a year earlier. Total generation was down nearly 8% from a year earlier at an average of roughly 23.4 GWh/day, as peakload slipped 2% year on year to average 27.254 GW in December, according to CAISO data. In the Northwest, peakload dropped nearly 11% year on year to average 7.89 GW in December, according to Bonneville Power Administration data. Hydropower remained the lead fuel source at nearly 74% of the mix, followed by nuclear at 12.3%, thermal at 9.6% and wind at 4.3%. Following El Nino expectations of the Northwest for warmer temperatures and drier precipitation, BPA population-weighted temperatures in December were 10% above normal and 21.5% higher than a year earlier, leading to 27% fewer heating-degrees days year on year, according to CustomWeather data.
News
After a year of positional uncertainty, the container industry is now shedding light on the impact of the EU Emissions Trading System on container shipping from 2024. The result has been one that generates more questions than clarity concerning the varying surcharge values that carriers are publishing. There are now growing signs that additional costs calculated are not only a body of guesswork from carriers themselves but a pathway to further difficulties in negotiations between counterparties involved in European shipping down the line. Carriers fundamentally misaligned Shipping's phase-in period for the EU ETS will commence on Jan. 1, 2024, according to the final compromise text by the European Environmental Committee, with 40% of emissions to be accounted for in the EU Monitoring Reporting and Verification, or MRV. In July 2022, when EU ETS regulatory developments were still in flux, A.P. Moller-Maersk first pushed its preliminary ideas on how incoming emissions charges for European container shipping may impact overall costs moving forward. In hindsight, these estimates were wholly inaccurate based on the final agreed upon package settled in April for shipping's introduction to the ETS in the form of a phase-in period. But what emerged back in 2022 was the market realization that EU ETS regulations will indeed impact shipping companies through additional publicized surcharges that contribute to overall freight costs. Since October, all major carriers have drip-fed their ETS surcharges in customer advisories, consequently revealing that there had been a growing understanding of complications in carrier calculations on several levels. First, evident discrepancies on all European shipping lanes among carriers reflect a mismatch of methodologies in applying quantifiable surcharges on emissions overheads for container shipping. COSCO has pushed so far the highest estimated Q1 2024 ETS surcharge of Eur28/TEU as the emissions costs for North Asia to North Europe. In contrast, German shipping company Hapag-Lloyd has released an ETS surcharge for the same period at just Eur12/TEU. The remaining five carriers have pushed their surcharges in the range of Eur20-30 /TEU. This is most certainly exacerbated by a number of carriers sending out surcharge updates re-evaluating initial quarterly valuations of emissions costs pushed in October. For example, Maersk -- having initially pushed the highest surcharge of Eur70/TEU in October, has sharply revised this down to Eur20/TEU on Dec. 1. Compounding these disjointed costs lies the methodological caveat in that surcharges are currently being calculated for emissions in 2024 that will need to be redeemed in the form of EU Allowances in late 2025. Lars Jensen, an analyst for the Journal of Commerce -- a sister company of S&P Global Commodity Insights -- recently said: "In all likelihood, this is down to a combination of different ways of allocating emissions at the container level and different approaches on how to handle the severe uncertainty related to having to charge now for an unknown cost to be paid in September 2025... If shippers found the post-IMO 2020 bunker fuel formulas confusing and misaligned across the carriers, just wait until they see the ETS surcharges." EUA volatility awaits One of the more problematic elements for shipping companies subjected to ETS surcharges is the lack of accounting for a malleable carbon market that will likely experience foundational change in the coming years. Increased volatility through seasonal gains and dips for which a quarterly cost will not account smacks of a situation in which market participants will be increasingly exposed. EUA prices witnessed a historic week in February with Nearest December Allowance contracts hitting an all-time high of Eur101.16/mt on Feb. 21, owing to winter weather and strong financial investor interest pushing higher demand at the beginning of the year. In contrast, prices hit a year-to-date low on Dec. 4 at Eur70.37/mt, with crimped demand from industry players affected by a gloomy economic outlook. But peering into the future, for carbon markets, the inclusion of maritime transport in the ETS is a crucial step that will likely impact the demand for EU allowances significantly, with an expected 90 million mtCO2e covered in 2024. The below-EUA forecast from S&P Global analysts reflects gradual increments in pricing value on an annual basis as more allowances get reduced into the market as part of the ETS 2030 emissions reduction target. Conversely, some carriers are choosing historical EUA data in bloc periods of 2023 to ascertain quarterly surcharges at the start of 2024, bringing a further sense of disjointedness in surcharge values against seasonal carbon market trends. Factor in or keep separate? Even as surcharges are expected to increase in the coming years, shippers who move a majority of their cargoes on a term contract basis remain focused on all-in freight costs, and are largely unconcerned with how the numerous surcharges take shape, as long as they have visibility into their freight invoices for the year. For some global markets, shipping's inclusion into the EU ETS is looked at with little concern -- for now. This is particularly true for North American market participants, who contrast double-digit emissions surcharges against all-in trans-Atlantic freight costs, which are currently just above record lows. "Everything gets washed out in the bottom line rate ... they just negotiate the bottom line, [the] carrier will sort that and designate certain surcharges," a source said. "It becomes irrelevant as long as bottom line doesn't change for shippers." With these emissions costs, assuming them into the bottom line rate appears be the demand from a Beneficial Cargo Owner's perspective – to have the surcharge infused into base freight levels and be able to have an all-inclusive freight number that is subject to negotiation between counterparties. Recent guidance has revealed that ETS surcharges for shipments out of China will indeed be factored into overall base freight levels due to regulatory adjustments from the country. But whether a future emissions cost will be a preferred separate surcharge or added cost in the form of emissions-accounted freight, some carriers have reiterated that these emissions costs are strictly non-negotiable. "There are some approaching this as if it is something that can be negotiated away but this is strictly not the case for us," a carrier source said. However, some large global freight forwarders are heard to be exhibiting capabilities to become exempt from ETS surcharges from carriers, with cargo volume in large tender negotiations sought after with higher priority than carriers seeking to be compensated on future allowances. The lack of an industry-wide authoritative command on the transparency of emissions costs to be passed down has led to a degree of confusion settling into the market as we head into 2024. Platts Carbon Emissions Charges for North Asia to North Continent, which calculates 100% of tank-to-wake carbon dioxide emissions on the North Asia to North Continent trade lane, reached an all-time high in on March 10, propelled by EUA costs at the time, but have sunk to record lows since launching in March. With emissions costs set to increase margin shares in European shipping as the phase-out unfolds, transparency in application of how these costs are constructed will become more scrutinized as the decarbonization model develops.