Feature: Rising US gasoline costs, refinery closures and the Renewable Fuel Standard

US refiners are taking their plea to the public with a new ad campaign launched by Fueling American Jobs Coalition asking President Biden to lower gasoline prices by fixing the Environmental Protection Agency's Renewable Fuel Standard, which mandates volumes of renewable fuel blending required by refiners.
"This new ad campaign comes as experts warn that the broken RFS is adding up to 30 cents/gal at the pump, and as Russia's war in Ukraine and record inflation push gas prices to near-record levels nationwide," the group said in an April 22 statement.
US gasoline prices are soaring just ahead of the summer driving season as a result of low inventories, the return of demand post-pandemic and more expensive crude oil, with some gasoline prices touching levels not seen since 2008, when crude prices hit $145/b.
US Gulf Coast cracking margins for WTI MEH are extremely high, averaging $35.76 so far in Q2 2022, up from the $20.84/b in Q1 2022, margin data from S&P Global Commodity Insights showed.
Stripping out the cost of RINs – the credits issued by the RFS and bought by refiners who are unable to blend enough renewables into their fuel to meet their renewable volume obligations – these margins drop by about $4/b to average $30.89/b in Q2 and $16.33/b in Q1 illustrating the impact of the RFS on refining margins and the cost of fuel.
Fueling American Jobs Coalition advocates an overhaul of the RFS to lower gasoline prices. Its campaign comes on the heels of President Biden's April 12 waiver to increase the use of renewable fuels by raising the blending volumes of less expensive ethanol into summer grade gasoline to 15% from 10%.
In a world of tight supply, increasing ethanol blending to 15% will indeed add supply and help lower gasoline prices for E15 consumers by about 3%-7%, according Renewable Fuels Association's president Geoff Cooper.
But the overall impact will be blunted by limited access by most US drivers to the higher ethanol fuel.
"It's becoming widely available – slowly – but at last check some 2,500 gas stations in the US offered it, mainly in the corn belt areas and the Midwest," said Patrick De Haan, analyst with Gasbuddy.com, which tracks gasoline demand and usage at 140,000 stations throughout the US and Canada.
There is contentious and litigious history between the renewable fuel lobby and the refiners, spanning back to 2005 and the inception of the RFS as part of the Energy Policy Act of 2005.
That law sought to protect US energy security from foreign oil risk by incentivizing renewables. This was prior to the shale revolution, increased crude production and the US becoming a major exporter.
John Auers, executive vice president at Dallas-based consulting firm, Turner Mason, said Biden's recent decision to allow E15 use is not expected to add a lot more ethanol into the gasoline pool.
""It's a political win. But not a giant one. And not super impactful on the market itself," he said. "There is not going to be a lot more ethanol that actually moves into the pool."
According to Renewable Fuel Association estimates, 814 million gallons of E15 was sold in the US in 2021 with an ethanol content of 122 million gallons. The E15 summer waiver will only add about 30 million gallons of ethanol to the pool.
Globally, tight gasoline and diesel supply stems from a spate of refinery closures, as the drop in demand due to coronavirus lockdowns culled less efficient plants.
"It's a big deal. We've lost 3.5 million b/d of refining capacity globally. And that's made everything tight," Auers said.
US gasoline supplies are holding just below the five-year average at 232.4 million barrels for the week ended April 15, the most recent US Energy Information Administration data showed. But supply in the central US Atlantic Coast is extremely low, well-below the five-year average at 26.95 million barrels for the week ended April 15, EIA data shows, amid a slowdown in imports from Europe.

Even with the rebound in demand, high refinery margins and low fuel supply, refiners are still closing their doors, with many citing the high cost of complying with the RFS as a reason for shutting their doors.
The latest announced closure was from LyondellBasell. In its April 21 statement, the company said was getting out of the refining business by shutting its 263,776 b/d Houston refinery after it was unable to find a buyer. In earlier statements made in September 2021, the company cited the high cost of complying with US RFS as a reason it was looking to sell the plant.
"More independent refinery closures would cause catastrophic job losses, even higher gas prices and increase our nation's reliance on foreign fuel at a time when few can afford it," the Fueling American Jobs Coalition said.
They are "urging President Biden and his administration to take swift action to lower gas prices, save union jobs, and protect America's energy independence by fixing the RFS once and for all," according to their statement.
This is a trend which could continue due to the high cost of the RFS, which could further tighten the market.
"It's a tight market now. And then we have to worry about hurricane season," Auers said.

News
India's unwavering appetite for Russian crude has provided ample bandwidth to Middle Eastern sour crude suppliers to cater to the needs of South Korea, Japan, Thailand and other East Asian buyers. Even if OPEC+ decides to extend production cuts, East Asian refiners are confident they can secure adequate Middle East sour crude term supplies. View full-size infographic Also listen:
News
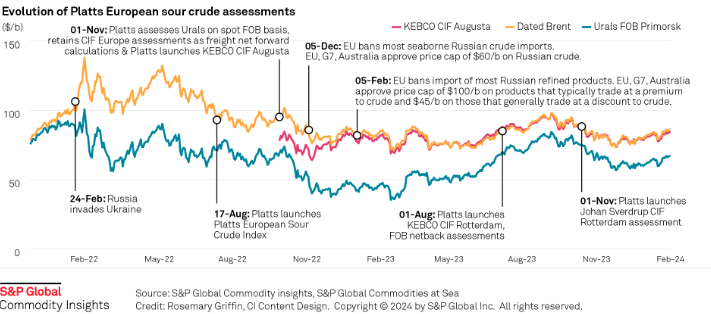
Russia's invasion of Ukraine has had a profound impact on sour crude export destinations, and increased the appetite for sweet crudes among European refiners. Platts methodology has evolved to reflect this changing landscape. Click here to see the full-size infographic.

News
Latest update: Jan. 30, 2024 A key OPEC+ advisory committee, co-chaired by Saudi Arabia and Russia, is set to meet online Feb. 1, with crude prices still stuck below the level that many of the alliance’s major producers need to balance their budgets. Traders will be seeking signals from the Joint Ministerial Monitoring Committee meeting on how long the bloc will keep the reins on its production and how it sees supply-demand fundamentals shaping up in the months ahead. Related story: OPEC+ monitoring committee prepares to meet as group battles sticky oil prices (Subscriber content) Click here to view the full-size infographic Compare hundreds of different crude grades and varieties produced around the world with Platts interactive Periodic Table of Oil .

News
Sumas spot gas down 90.6% year on year CAISO solar generation up 6 points in Dec US West power forwards are trending roughly 50% lower than year-ago packages on weaker gas forwards and above-normal temperatures forecast with El Nino weather conditions to linger into spring. El Nino conditions, which typically occur January through March, tend to bring more rain to the US Southwest and warmer-than-normal temperatures. The three-month outlook indicates a greater probability for above-normal temperatures across most of the Western US, with the exception of the Desert Southwest, according to the US National Weather Service's Climate Prediction Center. SP15 on-peak January rolled off the curve at $55.75/MWh, 79.4% lower than where the 2023 package ended, according to data from Platts, part of S&P Global Commodity Insights. The February package is currently in the low 50s/MWh, 70% below where its 2023 counterpart was a year earlier, while the March package is in the mid-$30s/MWh, 55.4% lower. In gas forwards, SoCal January rolled off the curve at $3.779/MMBtu, 97.9% below where the 2023 contract ended a year earlier, according to S&P Global data. The February contract is currently around $4.063/MMBtu, 78.9% lower than its 2023 counterpart at the same time last year, while the March contract is about $2.816/MMBtu, 63.2% lower. Gas plants burned an average of 1.815 Bcf/d in December to generate an average of 267.167 GWh/d, an analysis of S&P Global data showed. That's down 0.66% from November and a drop of 11.2 % from 2023. S&P Global forecast CAISO's gas fleet to generate around 220 GWh/d in February. In comparison, burning fuel at the same rate as February 2023 would consume 1.758 Bcf/d, a 6% decrease year on year. Spot markets In spot markets, power prices were down significantly from a year ago, when cold weather hit the region and drove up prices. SP15 on-peak day-ahead locational marginal prices averaged $43.49/MWh in December, 83% lower year over year and 11.2% below November prices, according to California Independent System Operator data. Helping pull down power prices, spot gas at SoCal city-gate was down 88.4% year on year and 40% lower month on month at an average of $3.554/MMBtu in December, according to S&P Global data. In the Northwest, Sumas spot gas was down 90.6% year on year at an average of $2.669/MMBtu. The decline in spot gas prices likely accounts for the lower average spot power prices month on month in December, said Morris Greenberg, senior manager with the low-carbon electricity team at S&P Global. Compared to a year earlier, CAISO population-weighted temperatures averaged 8% higher in December, resulting in 38.4% fewer heating-degree days, according to CustomWeather data. Fuel mix Thermal generation remained the lead fuel source at 46.1% of the total fuel mix in December, little changed year on year, while solar generation was up nearly 6 percentage points to average 14.7% of the mix, according to CAISO data. Hydropower remained strong, averaging 8% of the December fuel mix, 2 points higher than a year earlier. Total generation was down nearly 8% from a year earlier at an average of roughly 23.4 GWh/day, as peakload slipped 2% year on year to average 27.254 GW in December, according to CAISO data. In the Northwest, peakload dropped nearly 11% year on year to average 7.89 GW in December, according to Bonneville Power Administration data. Hydropower remained the lead fuel source at nearly 74% of the mix, followed by nuclear at 12.3%, thermal at 9.6% and wind at 4.3%. Following El Nino expectations of the Northwest for warmer temperatures and drier precipitation, BPA population-weighted temperatures in December were 10% above normal and 21.5% higher than a year earlier, leading to 27% fewer heating-degrees days year on year, according to CustomWeather data.