Platts to launch carbon-accounted Aframax tanker assessments on 4 European routes Aug 1
Platts, part of S&P Global Commodity Insights, will launch daily carbon-accounted Aframax dirty tanker freight assessments on four key routes in Europe, effective Aug. 1, 2022, to provide further transparency into this developing market.
These new assessments will reflect the cost to move crude oil or fuel oil on an Aframax tanker on each route, including the additional cost required to offset 100% of the carbon dioxide emissions created through the combustion and exhaust of a ship's marine fuel through the European Union's Emissions Trading System (ETS).
These assessments add to the suite of freight carbon intensity values and freight carbon intensity premiums Platts has already been publishing since October 2021, which measure the impact of greenhouse gas emissions to transport various crude grades from production storage terminals to typical refinery locations around the world.
The new carbon-accounted Aframax freight assessments will be published in Worldscale points as well as in US dollars/mt.
The new assessments are:
Last July, the European Commission proposed adding shipping to the EU ETS gradually from 2023 to 2026, when shipowners would need to buy permits covering all their emissions inside the EU and 50% of their emissions from international voyages beginning and ending in the EU.
The Environmental Committee of the European Parliament voted in May 2022 to delay the inclusion of the shipping sector into the EU ETS from 2023 to 2024, but require that 100% of emissions from intra-EU voyages be covered from the outset, dropping previous plans for a phase-in period between 2023-2026. The latest EU proposals will look to cover 50% of emissions for voyages into and out of the European Economic Area until 2027, and 100% of emissions of these voyages thereafter.
The vessel speed and bunker fuel consumption used in the calculations of the new carbon-accounted freight assessments were arrived at by extensive market survey and reflect market practice. The calculations will use the daily EU Emission Allowance Nearest-December price (EADLP00) as published by Platts. The tank-to-wake carbon emissions based on the fuel consumption will be calculated using the carbon conversion factors published in Annex 1 of Regulation (EU) 2015/757 of the European Parliament and of the Council on the monitoring, reporting and verification of carbon dioxide emissions from maritime transport. These carbon conversion factors, to be published by Platts from Aug. 1, are:
Platts will publish the values defined in the relevant European legislation and will reflect any updates accordingly.
The new assessments will be published in the Platts Dirty Tankerwire; on Platts Global Tanker pages PGT1960 and 1961, Platts Shipping Alert pages 1430 and 1431, as well as in the Platts price database under the codes above.
Please send all comments or questions to shipping@spglobal.com and pricegroup@spglobal.com.
For written comments, please provide a clear indication if comments are not intended for publication by Platts for public viewing. Platts will consider all comments received and will make comments not marked as confidential available to the public upon request.
News
Russia, one of the world’s largest oil suppliers, has increasingly turned to non-Western firms to transport its crude to overseas buyers during its ongoing war with Ukraine . With a dual goal of undermining Russia’s war chest without creating significant disruptions to global supplies amid inflation pressure, G7 countries and their allies have banned tanker operators, insurers and other services firms from facilitating seaborne Russian crude exports unless the barrels are sold for no more than $60/b. The price cap regime, which came into force Dec. 5, 2022, does not directly cover tankers flagged, owned and operated by companies outside the G7, the EU, Australia, Switzerland and Norway, and not insured by Western protection and indemnity clubs. While such ships tend to be older and less maintained, their share in Russia’s crude exports market has been rising in recent months amid strengthening prices of Urals -- the OPEC+ member’s flagship crude grade -- and tightening sanctions enforcement by the West. Non-price-capped tankers have a larger market share in shipping Russia’s Pacific crude exports, according to analysis of S&P Global Commodities at Sea and Maritime Intelligence Risk Suite data. Crudes such as Sokol, Sakhalin Blend, and Eastern Siberia–Pacific Ocean grades are more often involved in these trades than Russian barrels from Baltic or Black Sea ports like Urals. Tanker operators in Greece, Europe’s top shipowning nation, managed to keep their traditionally strong market position in Russia in the first few months since the price cap took effect before giving ways to their peers in the UAE, Russia, China and Hong Kong. (Latest update: April 5, 2024)

News
Red Sea shipping volumes have slumped more than 60% since November as vessels opt for the longer Cape route to avoid Houthi attacks. But even as the severity of the attacks mounts, freight rates have retreated from recent highs and oil-on-water may have peaked as trade flows adjust. Click to see the full-size infographic
News
A series of attacks on shipping routes in the Red Sea has so far spared oil supplies from witnessing major disruptions, but oil importing countries are spending sleepless nights amid concerns that any escalation could potentially alter the situation drastically. Although the attacks disrupted container shipping lines, oil shipments remain largely stable. However, concerns stem from the fact that supply chains will likely have to adjust very quickly should the disruption persist. As existing oil tanker contracts are often hard to change, some ongoing traffic will continue to move through Red Sea passages. Any new insurance issued for Red Sea routes could add about $1/b or more to voyage costs, according to S&P Global Commodity Insights. Re-routing will increase voyage length, in-transit times and fuel costs. In addition, it will result in higher vessel utilizations, which could lift global freight rates as well as widen inter-regional crude spreads. Surely, more ships are avoiding the Red Sea and Bab al-Mandab strait after a spate of attacks by Yemen's Houthi militants, threatening the strategic chokepoint for global seaborne trade. Many shippers, tanker owners and some oil companies have suspended voyages through the area. Russia's oil exports are particularly exposed to further Red Sea disruptions as Moscow ships some 80% of its crude to Asian markets. The attacks are expected to keep insurance costs high and prompt many tankers to take the longer route via the Cape of Good Hope, increasing ton miles and voyage durations, as well as tightening supplies and driving up freight rates. Even for the route via the Suez Canal, higher fees effective this year combined with a carbon tax for Europe-bound cargoes, will increase overall costs for charterers. Special report: Taking the long way around: Ships divert from the Panama Canal Although the rerouting of tankers away from the Red Sea, a major conduit for oil loaded in Russia, will surely raise shipping costs, the impact will be transitory. Roughly 7 million-8 million b/d of crude oil and products transited the Red Sea in recent months, according to S&P Global data. The market, for sure, will adjust to the changing flows, but the re-routing will lead to more oil on the water for a longer period of time. Russian crude shipments, should they avoid the Red Sea, are most affected due to a much longer haul to Asia around Africa. And amid tighter fleet capacity, lingering geopolitical conflicts are expected to boost tanker freight in 2024 despite ongoing OPEC+ supply cuts and a possible slowdown in oil demand growth. Implications for Asia As the biggest oil importing region, Asia may not witness dramatic changes to near-term oil supplies amid the ongoing Red Sea crisis, but refiners are chalking out alternative plans to ensure steady feedstock flows in the event of an escalation, a move that could inflate insurance costs and crimp refining margins. Although the region relies on imported oil for the bulk of its needs, the strategic push among Asia's top importers to massively diversify their import baskets over the years, as well as expand strategic storage, will come in handy to ensure smooth and uninterrupted flow of feedstocks. The Red Sea crisis has three aspects to it, as far as Asian oil flows are concerned. First, any escalation will create hurdles for Russian crude flowing to Asia, forcing buyers to look for substitutes from other origins. Secondly, for products moving from Asia to Europe, exporters are cautiously watching developments before taking the plunge. And lastly, longer routes have the potential to create incremental bunker fuel demand in Asia. Oil flows into China have not been impacted much by the Red Sea turbulence, as fewer cargoes are headed there on that route. In addition, the impact on Russian oil flows to India has been minimal, with no major diversions seen so far. Russia contributed over 35% of India's total crude imports in 2023, amounting to 1.7 million b/d, according to S&P Global data. Asian oil buyers are not necessarily concerned about Middle Eastern sour crude supplies for 2024, as major sellers, including Saudi Aramco and Abu Dhabi National Oil Co., fully respect Asian customers' demand regardless of their production cut commitments. However, the economics for cracking Middle Eastern sour crude have been deteriorating as the costs of bringing Persian Gulf barrels to the Far East have been rising with shippers demanding risk premiums, while tanker insurance costs are also trending higher. Asian refiners may even look at cutting Middle Eastern term contractual volumes and explore other options like African, US and South American crudes to maximize margins. US crudes, for one, is becoming increasingly more attractive for Asian refiners as the price of lighter and sweeter WTI crude is nearly on par with high-sulfur Persian Gulf grades on a delivered basis. Supply cushion The attacks in the Red Sea continued even after the US-led alliance took military action to establish deterrence. The risk of a wider escalation also increased with Pakistan's retaliatory strikes against Iran for alleged Iranian militant attacks in Pakistan. Overall, the geopolitical tensions in the Middle East have only increased over the weeks. However, oil markets have largely shrugged aside the risk due to a lack of physical disruption to oil shipments and weak macro fundamentals. But increased risk in the Middle East is probably putting a floor to oil prices amid weak demand. S&P Global expects fundamentals to improve in the second half of 2024 and prices to move up. Still, OPEC+ market management and the alignment between Saudi Arabia and Russia on OPEC+ policy will be critical for oil markets in 2024. S&P Global forecasts Platts Dated Brent to average $83/b in 2024 and $76/b in 2025. A sharper economic slowdown or disagreement within OPEC+ on production restrain remains the biggest risk for oil markets going into 2024. By: Sambit Mohanty, Editorial Lead, Asia Energy News, S&P Global Commodity Insights, S & P Global Commodity Insights Further reading: Red Sea shipping risk
News
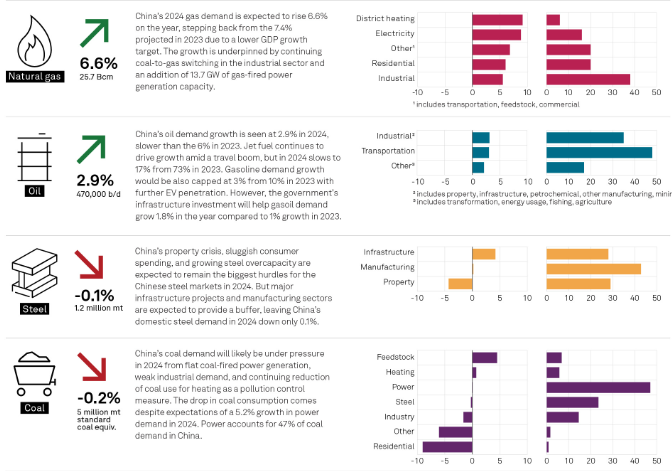
China on Jan. 17 released its 2023 GDP growth at 5.2%, meeting its target set in March last year. S&P Global projects China’s 2024 GDP growth to slow to 4.7% after the country's annual economic conference held in December implied that any fiscal and monetary measures taken in 2024 were unlikely to be more aggressive than in 2023. This sets a weak tone for commodity markets in terms of end-user demand. Click here to see the full size version