Oil and gas upstream, midstream operations primed for affordable decarbonization: IEA

Reducing scope 1 and scope 2 emissions from oil and gas activities is the most cost-effective way to reduce emissions by 2030 compared to any other source in the global economy, the International Energy Agency said in a May 3 report.
The IEA estimates that 15% of energy-related emissions, or 5.1 billion mt of CO2e, stem from upstream and midstream oil and gas activities – from extracting the fuels out the ground to delivering them to end users. But that 15% is also the lowest hanging fruit for reductions.
"These emissions can and should drop by more than half by 2030, and it's one of the cheapest ways of cleaning up the energy system," IEA Energy Analyst Peter Zeniewski said in a tweet announcing the new research.
The upfront cost for reducing those emissions by half by 2030 is $600 billion, which, as the IEA described, amounts to just 15% of the profits oil and gas producers generated during the 2022 energy crisis. In February, IEA Executive Director Fatih Birol said that the industry's 2022 income jumped to $4 trillion – a 166% rise over its annual $1.5 trillion average.
While a number of these oil and gas companies have announced commitments to reduce their scope 1 and 2 emissions, only a fraction of those commitments matches the pace of decline needed to reach net-zero by 2050, the IEA said. And many of those commitments rely heavily on the use of carbon offsets.
"Forward leaning companies need to recognize the need to move faster than the global average reduction in emissions and build a broader coalition of companies willing to play their part," the May 3 report said.
The IEA identified the five most cost-effective methods for reducing the industry's scope 1 and 2 emissions. The leading method is cutting methane emissions from oil and gas operations, which could reduce emissions by 1.2 billion mt of CO2e. According to Zeniewski, that reduction amounts to more CO2e than those associated with the aviation industry.
In the IEA's scenario, one third of methane emissions reductions is attributable to oil and gas demand declines. The remaining two thirds stem from widespread efforts across the supply chain, in which all producers would "have an emissions intensity similar to the world's best operators today."
The price of a Methane Performance Certificate was assessed at $0.014/MPC, or $2.307/mtc, on May 3, according to data from S&P Global Commodity Insights.
The second most important measure is an overall elimination of non-emergency flaring, a practice that sent about 500 mt of CO2e into the atmosphere in 2022. The IEA suggests bringing the excess gas to consumers via new or existing pipeline networks, converting it into compressed or liquified natural gas, or reinjecting it into reservoirs to increase pressure.
The third most important measure would be to electrify upstream operations, or using electricity to power drilling rigs, pumps, compressors and other equipment in the oil fields rather than diesel fuel or natural gas. Globally, these upstream operations resulted in more than 700 million mt of CO2 emissions in 2022. By taking advantage of on-site renewable resources or hooking operations up to the grid, electrification can halve CO2 emissions from the upstream sector by 2030.
These three methods – electrification, reducing methane, and eliminating flaring – all have the potential to create new revenue streams to recoup upfront costs. For instance, while eliminating flaring would cost the industry $70 billion today, it could also generate $91 billion in revenue by 2030.
"For facilities implementing these measures, the average cost of producing oil and gas would increase by les than $2 per barrel of oil equivalent," the IEA said.

The final two methods involve increasing deployment of carbon capture technologies across oil and gas processes and expanding the use of low carbon hydrogen in refineries.
"Scaling up CCUS and expanding the use of low-emissions hydrogen play complementary roles but have significant potential for positive spillover into other aspects of energy transitions, by accelerating deployment and technology learning for these technologies," the report said.
At a cost of $110 billion, CCUS deployment could account for a reduction of 188 million mt CO2e by 2030. Hydrogen could account for a reduction of 66 million mt CO2e by 2030 at a cost of $83 billion.
The development of both technologies is being led by the oil and gas industry. While 90% of all carbon capture and storage capacity is operated by oil and gas companies four of the five largest green hydrogen plants under construction are also being developed by the industry.
News
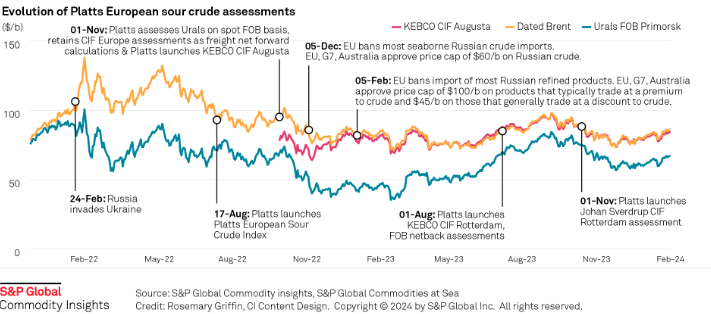
Russia's invasion of Ukraine has had a profound impact on sour crude export destinations, and increased the appetite for sweet crudes among European refiners. Platts methodology has evolved to reflect this changing landscape. Click here to see the full-size infographic.

News
Coal production to hit all-time low of 489 mil st Coal to cede generation share to renewables Nominal average delivered coal prices at $2.49/MMbtu The US Energy Information Administration Jan. 9 revised downward its 2024 coal export projection to 91 million st, which if realized would be 9% lower than 2023 exports of 100 million st. The EIA's January Short-Term Energy Outlook marked a 2.7% downward revision on the month for 2024 projected coal exports. Coal exports in 2025 are projected to recover 4.8% on the year to 95.4 million st. Lower coal demand was reflected in the EIA's 2024 US coal production estimate representing an all-time low. The EIA projected that coal production will fall 15.9% on the year to 489.3 million st in 2024 before declining another 12.4% year on year to 428.8 million st in 2025. Total coal consumption was projected at 391.3 million st in 2024, up 1.6% from the prior month's projection. The EIA estimated 2025 total coal consumption at 361.7 million st. For the electric power sector, coal consumption was estimated at 351.9 million st in 2024, down 8.4% from the prior year. For 2025, electric power sector coal consumption was projected at 322.2 million st, which would be an all-time low if realized, according to EIA data going back to 1997. Nominal average delivered coal prices were estimated at $2.49/MMbtu in 2024, down from $2.52/MMBtu in 2023. The EIA projected that 2025 nominal average delivered coal prices would shrink further to $2.44/MMBtu. Platts assessed US over-the-counter Central Appalachia 12,500 Btu/lb CSX rail coal for February delivery unchanged on the session at $72.40/st Jan. 8, showed data from S&P Global Commodity Insights. The assessment was based on broker indications of value at $72/st and $72.75/st, tested in the market through 4:30 pm ET. The Jan. 8 CAPP assessment at $72.40/st was equivalent to $2.896/MMBtu. The CAPP coal price averaged $81.12/st in 2023, the equivalent of $3.245/MMBtu. Powder River Basin 8,800 Btu/lb rail coal for prompt-month delivery closed at $13.95/st Jan. 8, unchanged on the session, based on broker indications of value at $13.85/st and $14/st. The assessment at $13.95/st was equivalent to $0.793/MMbtu. The coal averaged $14.46/MMbtu in 2023, the equivalent of $0.822/MMBtu. In line with falling coal consumption, coal's share of US power generation is expected to slip to 14.8% in 2024, down from 16.6% in 2023. The EIA projected coal generation at 13.3% in 2025 as renewables generation increases. Renewable energy sources totaled 21.8% of 2023 US generation share. Generation from renewables was projected to rise to 24% in 2024 and 25.9% in 2025. Nuclear generation's share was estimated to remain steady between 19.2% and 19.3% between 2024 and 2025. Natural gas generation, which constituted 41.9% of the US generation share in 2023, was projected to fall to 41.5% in 2024 and 41.1% in 2025. The EIA estimated that the Henry Hub spot price will average $2.76/MMbtu in 2024, down from the December 2024 estimate of $2.90/MMBtu. For 2024, the EIA projected Henry Hub prices at $3.06/MMBtu. The prompt-month NYMEX Henry Hub natural gas futures contract settled at $2.98/MMBtu Jan. 8, according to CME Group data. In 2023, the Henry Hub price averaged $2.665/MMBtu. Dry natural gas production was estimated at 105.04 Bcf/day in 2024, up from 103.54 Bcf/d in 2023. The EIA estimated that dry natural gas production would increase to 106.38 Bcf/d in 2025. LNG exports are expected to rise 4.4% on the year to 12.36 Bcf/d in 2024 before jumping 16.7% year on year to 14.42 Bcf/d in 2025. Total natural gas consumption for 2024 was projected at 89.91 Bcf/d, up 1.1% on the year. Total consumption of natural gas was projected to fall 0.2% on the year to 89.71 Bcf/d in 2025. Natural gas consumption in the US power sector was projected to rise 1.1% on the year to 35.54 Bcf/d in 2024. The EIA estimated that 2025 natural gas consumption in the US power sector will decline 0.7% on the year to 35.29 Bcf/d.

News
Sees $2.5 bil-$4.5 bil impairment amid weak margins Throughput impacted by North America maintenance Upstream output set to steady in Q4 Shell on Jan. 8 highlighted a weak fourth quarter for its refining and chemicals unit due to lower margins and a maintenance impact on throughput, as it warned investors of an expected financial impairment of $2.5 billion-$4.5 billion, primarily in the downstream. Shell said in December it plans to offload its 500,000 b/d Singapore refining and chemicals operations due to a lack of advantage in feedstock, energy and utility costs, starkly contrasting with the company's earlier enthusiasm for opportunities in Asia in the previous decade. Shell's global indicative refining margin dropped from $15.72/b in Q3 2023 to $10/b in Q4, and it said it expected significantly lower results from chemicals and products trading compared with Q3, with the chemicals and products unit set for an adjusted earnings loss. Results were also affected by a slump in refinery throughput to a range of 78%-82%, a level reminiscent of the pandemic, but due to planned maintenance at its North American refining operations. Shell's North American downstream business is spread across two sites in Canada and one in the US: the 100,000 b/d Scotford refinery in Alberta, which processes synthetic crude derived from oil sands, and the 85,000 b/d Sarnia refinery near Ontario, as well as the 250,000 b/d Norco refinery in Louisiana. Scotford was expected to operate at reduced levels during maintenance in October, while Norco was expected to be under maintenance for most of that month, S&P Global Commodity Insights reported earlier. Steadier upstream Elsewhere in its business, there were some signs of more stable upstream production, with the midpoint of Shell's guidance for the upstream unit higher than output in Q4 2022. It forecast production in a range of 1.83 million-1.93 million b/d of oil equivalent, offset by a potential fall in production in the LNG-focused Integrated Gas unit, to 880,000-920,000 boe/d. Shell's oil output declined significantly between 2019 and 2022, and particularly during 2022. Shell confirmed its earlier guidance that LNG liquefaction volumes for Q4 2023 were higher than a year earlier, in a range of 6.9 million-7.3 million mt, although that is also significantly below pre-2022 levels. It added that financial results from LNG trading were expected to be "significantly higher" than in Q3 2023 due to "seasonality and increased optimization opportunities." The Platts Dated Brent benchmark was assessed $4.53/b lower on average in Q4 2023 compared with a year earlier at $84.34/b. Platts is part of S&P Global Commodity Insights.

News
Sumas spot gas down 90.6% year on year CAISO solar generation up 6 points in Dec US West power forwards are trending roughly 50% lower than year-ago packages on weaker gas forwards and above-normal temperatures forecast with El Nino weather conditions to linger into spring. El Nino conditions, which typically occur January through March, tend to bring more rain to the US Southwest and warmer-than-normal temperatures. The three-month outlook indicates a greater probability for above-normal temperatures across most of the Western US, with the exception of the Desert Southwest, according to the US National Weather Service's Climate Prediction Center. SP15 on-peak January rolled off the curve at $55.75/MWh, 79.4% lower than where the 2023 package ended, according to data from Platts, part of S&P Global Commodity Insights. The February package is currently in the low 50s/MWh, 70% below where its 2023 counterpart was a year earlier, while the March package is in the mid-$30s/MWh, 55.4% lower. In gas forwards, SoCal January rolled off the curve at $3.779/MMBtu, 97.9% below where the 2023 contract ended a year earlier, according to S&P Global data. The February contract is currently around $4.063/MMBtu, 78.9% lower than its 2023 counterpart at the same time last year, while the March contract is about $2.816/MMBtu, 63.2% lower. Gas plants burned an average of 1.815 Bcf/d in December to generate an average of 267.167 GWh/d, an analysis of S&P Global data showed. That's down 0.66% from November and a drop of 11.2 % from 2023. S&P Global forecast CAISO's gas fleet to generate around 220 GWh/d in February. In comparison, burning fuel at the same rate as February 2023 would consume 1.758 Bcf/d, a 6% decrease year on year. Spot markets In spot markets, power prices were down significantly from a year ago, when cold weather hit the region and drove up prices. SP15 on-peak day-ahead locational marginal prices averaged $43.49/MWh in December, 83% lower year over year and 11.2% below November prices, according to California Independent System Operator data. Helping pull down power prices, spot gas at SoCal city-gate was down 88.4% year on year and 40% lower month on month at an average of $3.554/MMBtu in December, according to S&P Global data. In the Northwest, Sumas spot gas was down 90.6% year on year at an average of $2.669/MMBtu. The decline in spot gas prices likely accounts for the lower average spot power prices month on month in December, said Morris Greenberg, senior manager with the low-carbon electricity team at S&P Global. Compared to a year earlier, CAISO population-weighted temperatures averaged 8% higher in December, resulting in 38.4% fewer heating-degree days, according to CustomWeather data. Fuel mix Thermal generation remained the lead fuel source at 46.1% of the total fuel mix in December, little changed year on year, while solar generation was up nearly 6 percentage points to average 14.7% of the mix, according to CAISO data. Hydropower remained strong, averaging 8% of the December fuel mix, 2 points higher than a year earlier. Total generation was down nearly 8% from a year earlier at an average of roughly 23.4 GWh/day, as peakload slipped 2% year on year to average 27.254 GW in December, according to CAISO data. In the Northwest, peakload dropped nearly 11% year on year to average 7.89 GW in December, according to Bonneville Power Administration data. Hydropower remained the lead fuel source at nearly 74% of the mix, followed by nuclear at 12.3%, thermal at 9.6% and wind at 4.3%. Following El Nino expectations of the Northwest for warmer temperatures and drier precipitation, BPA population-weighted temperatures in December were 10% above normal and 21.5% higher than a year earlier, leading to 27% fewer heating-degrees days year on year, according to CustomWeather data.