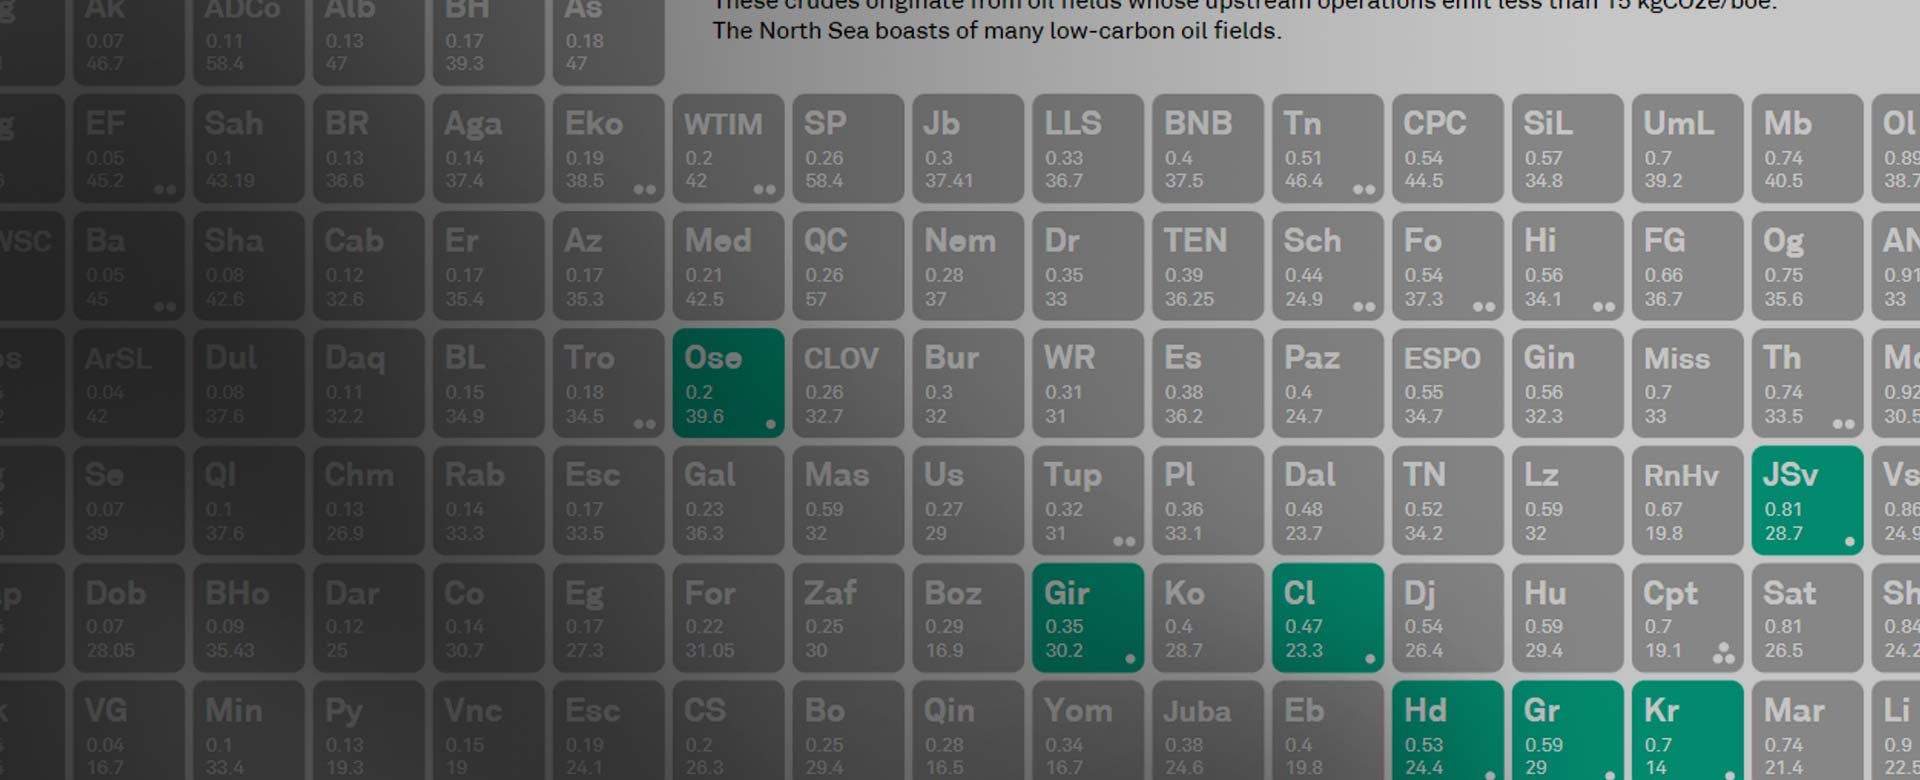
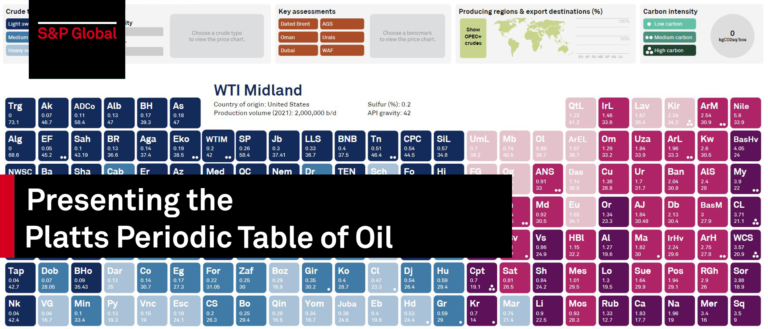
Interactive: Platts Periodic Table of Oil - 4th edition adds carbon intensity data

Thought Leadership
The price wall visualizes 258 of the most important price benchmarks assessed by Platts across various commodities from crude through to chemicals, LNG and carbon. The wall shows the price performance of these benchmarks over 2023 based on their indexed value from the first day of trading. Click on the commodity button to isolate different groups of resources to see which performed best in 2023, a year that saw dramatic changes in trade flows and demand because of sanctions and price caps on Russian commodities and a recovering post-COVID global economy. Isolate individual benchmarks by clicking on the tile to reveal a unique QR code to navigate to specific Platts methodology pages and average price data for 2022 and 2023. Click to start exploring

Thought Leadership
Interview with Sambit Mohanty, Asia Energy Editor, S&P Global Commodity Insights 1. What do you think will be one of the main themes for Asian oil markets in the near to medium term? Asia is expected to account for the bulk of global oil demand growth in 2024, but strong economic growth will help India's demand growth edge past that of China, where economic headwinds will likely keep a lid on appetite for fossil fuels. Our own forecast suggests that South Asian demand will likely increase by 3.2% in 2024, exceeding mainland China's 2.9% in 2024. The International Energy Agency has recently said that India' will become the largest source of demand growth from now until 2030. And in the same period, oil demand growth in developed economies and China will initially slow down and then subsequently go into reverse. 2. Building on what you have already said, India is surely emerging as the brightest spot for oil demand. Many refineries are still pursuing expansion. How will the refining outlook shape up in India over the next few years? India will be one of the few countries to witness refining capacity growth over the next few years, but expansions will reflect a bigger share of petrochemicals as refiners look to widen their product slate to reduce overdependence on transport fuels. India's state refiners' expansion programs would focus increasingly on boosting conversion ratios from crude to petrochemicals to about 10%-15%, from around 4%-5% currently. But at the same time, there is a need to be conscious of their responsibility to fight climate change. As a result, refiners will need to increasingly use technologies to ensure that emissions are minimized. 3. You recently met with many Indian oil and gas CEOs as part of the India CEO Series by S&P Global Commodity Insights. You also had an interaction with India's petroleum minister Hardeep Singh Puri. What were the key points that emerged from those discussions? As part of the India CEO Series, I spoke to many government and industry leaders in India's oil and gas sector to get insights on how those companies are planning to strike a balance between traditional and new businesses at a time when energy transition is changing the industry's landscape, while geopolitical turbulence is throwing up new challenges. The key theme that emerged was that India must ensure affordable oil and gas for its citizens by continuing to invest in the sector, while making an orderly transition to clean energy without vilifying fossil fuels. Also, as energy transition gathers pace, India is hoping that gas can act as a bridge fuel, with domestic production going up at a healthy pace. The country is also nurturing ambitions to be a major producer and consumer of green hydrogen. It also expect biofuels to place a crucial role in the country's energy mix. India's Minister for Petroleum and Natural Gas Hardeep Singh Puri with Asia Energy Editor Sambit Mohanty 4. For Asia as a whole, one of the key themes on the supply side has been the drastic change in oil flows since the Russia-Ukraine war started. If you can share your insights on how the oil flow map has evolved and what's in store for the foreseeable future? The spotlight will remain on Asia's unwavering appetite for Russian crude which has catered to refiners in India and China in a big way since the start of the Russia-Ukraine war, tilting the balance away from Middle Eastern supplies. Middle Eastern crude share in China's total import basket fell to about 46% in 2023, from nearly 53% in 2022, as Russia took the top supplier position in China. Meanwhile, India's crude imports from Middle Eastern suppliers tumbled 21% in 2023, while Russia contributed over 35% of India's total crude imports. India and China are expected to continue favoring Russian crude in 2024, leaving ample Middle Eastern sour crude supplies available for other Asian buyers, such as Japan and South Korea. 5. Staying on the same supply theme, with OPEC+ deciding to extend its production cuts, do you think there's a reason for Asia to worry? Asian crude buyers are unlikely to face a supply squeeze following extended production cuts by OPEC+ and Russia's move to slash output by an extra round. This year, there will be plentiful non-OPEC supplies to fill any potential void. While the recent developments have largely laid out a clear near-term supply roadmap for global crude oil for the next few months, a feeble market reaction to those decisions suggests that demand growth, mainly in Asia, may fall short of pick up in overseas supply on the back of rising production in countries, such as the United States and Brazil. The International Energy Agency said that with stronger-than-expected output from key American producers this year, it expected global oil supplies to average a record 103.8 million b/d in 2024. 6. How important do you think continued investments in upstream oil projects will be for global energy security? Asian countries will have to keep investing in the upstream sector to ensure higher oil and gas production to avoid possible supply problems or volatile energy prices, but there is a need to embrace technologies that are more environment friendly. On a global scale, there will be a need to pursue multiple pathways to ensure uniform energy transition for all. There is no one-size-fits-all solution to a sustainable energy future. 7. Do you think the Red Sea crisis will prompt Asia to rethink oil policy or near-term supplies are largely intact? Asia may not witness dramatic changes to near-term oil supplies amid the ongoing Red Sea crisis, but refiners are chalking out alternative plans to ensure steady feedstock flows in the event of an escalation. These developments could potentially inflate insurance costs and crimp refining margins. However, the strategic push among Asia's top importers to massively diversify their import baskets over the years, as well as expanding strategic storage, will come in handy to ensure smooth and uninterrupted flow of feedstocks. That said, a series of attacks on shipping in the Red Sea have compelled traders and suppliers to explore alternative routes via the Cape of Good Hope but crude shipments to countries like India and China have remained largely unaffected. 8. As geopolitical tensions mount, do you think this will make oil storage expansion imperative in Asia -- for example in countries such as India? India's vulnerability is apparent, especially in the face of recent disruptions, such as those witnessed in the Red Sea or heightened tensions in the Middle East. Any unforeseen situation along the supply route has the potential to jeopardize energy security. This underscores the need for strategic measures and investments to enhance the country's energy resilience and mitigate risks associated with external dependencies. Indian Strategic Petroleum Reserves Ltd. currently have a capacity of 5.33 million mt, providing for about 9.5 days of total net oil imports. In addition, state oil companies hold storage facilities for crude oil and petroleum products for 64.5 days of total net imports. Adding those two numbers the current total national capacity for storage of crude oil and petroleum products stands at 74 days of total net imports. On the other hand, IEA member countries are required to ensure oil stock levels equivalent to no less than 90 days of their net imports. 9.The big debate for Asia is the debate on cleaner vs cheaper fuels. With the region dependent on oil and coal in a big way for its energy needs, do you think Asia's policy dilemma is here to stay for now? Asia today is relatively better placed to strike a balance between providing affordable and sustainable energy, as well as ensuring energy security, compared to where it was a few years ago. But the biggest headache for policy makers in the region will be that the pace at which Asia can move away from fossil fuels -- oil, gas and even coal -- won't be anywhere near the speed at which the Americas and Europe are embracing the changing energy landscape. Although renewables, such as hydrogen and solar, have started figuring in ambitions of many Asian countries, the region's addiction to oil and coal is something that's not going to go away anytime soon.
Thought Leadership
India must keep investing in the upstream sector to ensure higher oil and gas production to avoid possible supply problems or volatile energy prices, as it embraces technologies that are more environment friendly, Mannish Mahesshwari, CEO of Invenire Energy, told S&P Global Commodity Insights. "Flipping the lens to energy security, sustained under investment in upstream without substitutional capacity and substantial scale in clean and new energy could have far reaching consequences in the journey of just transition," Mahesshwari said on the sidelines of the India Energy Week in Goa. Most of assets of private equity backed Invenire are discovered fields in India that the company has acquired through secondary market purchases from other firms as well as through primary acquisitions directly from the government. The company also has assets in Indonesia and East Africa. The private upstream firm is looking to accelerate production of oil and gas from the discovered fields in its portfolio but has no plans to venture into exploration in the foreseeable future. "We are putting our money where our mind is. As a company, our ability to understand the rocks and the molecules is relatively better than the electrons. We are investing in today's energy system, which is mainly oil and helping in phasing out coal with the help of low-carbon gas," Mahesshwari said. He said that the transition to a world of net zero is more certain today than envisaged in 2015, the year of the Paris Agreement. However, it is the uncertainty around the energy transition pace that adds complexity and risk for upstream projects. The upstream industry has been avoiding spending on projects that would either lock in heavy emissions for years to come or quickly turn into stranded assets. Right focus Invenire currently holds stakes in nine blocks in India. Out of these, four are discovered small fields (DSF) blocks -- one in Assam and three in Mumbai offshore -- comprising a total of about 100 million barrels equivalent of oil and gas. Invenire holds a 100% stake in the four DSF acreages. The company has a small production portfolio of about 12,000 b/d but has plans to boost that volume to 35,000 b/d by 2025. According to S&P Global, Invenire Energy's upstream plans show ambition and promise, considering the wider competitive landscape in India. The company's experience of operating in a tough post-2014 upstream period that saw oil prices slump will certainly influence its post-2023 growth ambitions. For assets outside India, the company might have plans to become a non-operator joint venture partner to take stakes in small-to-medium sized producing assets. The company's focus has been on monetizing discovered resources, having both operator and non-operator portfolios, S&P Global said. Besides India, Invenire has producing fields with 45.55% participating interest in a material acreage located in South Sumatra Basin in Indonesia. "The upstream industry's main focus now is to deliver the supply required to meet demand. Most of the industry's oil and gas investment for the rest of this decade will target advantaged resources -- those with the lowest cost, least risk, and possibly lowest Scope 1 emissions. Beyond this decade, to meet demand, the industry will depend increasingly on late-life reserves growth from legacy supply sources." Mahesshwari said. Similar views Mahesshwari's views echoed comments made by state-run upstream producers ONGC Ltd. and Oil India Ltd. at the IEW conference. ONGC Ltd., which contributes about 74% of India's crude oil and around 63% of its natural gas production, has been actively looking to widen its upstream portfolio as it believes that oil and gas will be a major component of the country's energy mix for the next three decades, while pursuing new crude-to-chemicals projects to prepare for the changing energy landscape, its Chairperson Arun Kumar Singh told the conference. Oil India Ltd. is aiming to double its exploration acreage in the coming years and seeking partnerships to realize the hydrocarbon potential of offshore regions in Indian sedimentary basins, its Chairman and Managing Director Ranjit Rath said. Mahesshwari said that there is a need to take a balanced view of energy transition, adding that any shortfall in upstream investments can add to supply issues and volatile energy prices, as seen in recent years. While it's important to keep looking for opportunities to invest in low-carbon businesses, continuing to responsibly invest in the core upstream business will remain the priority for the company in the foreseeable future. "The potential in carbon capture utilization and storage is enormous, and the oil and gas sector has unique skills that make it ideally placed to lead in reducing CO2 and methane emissions and decarbonize hard-to-abate sectors through carbon upcycling," Mahesshwari said.
Thought Leadership
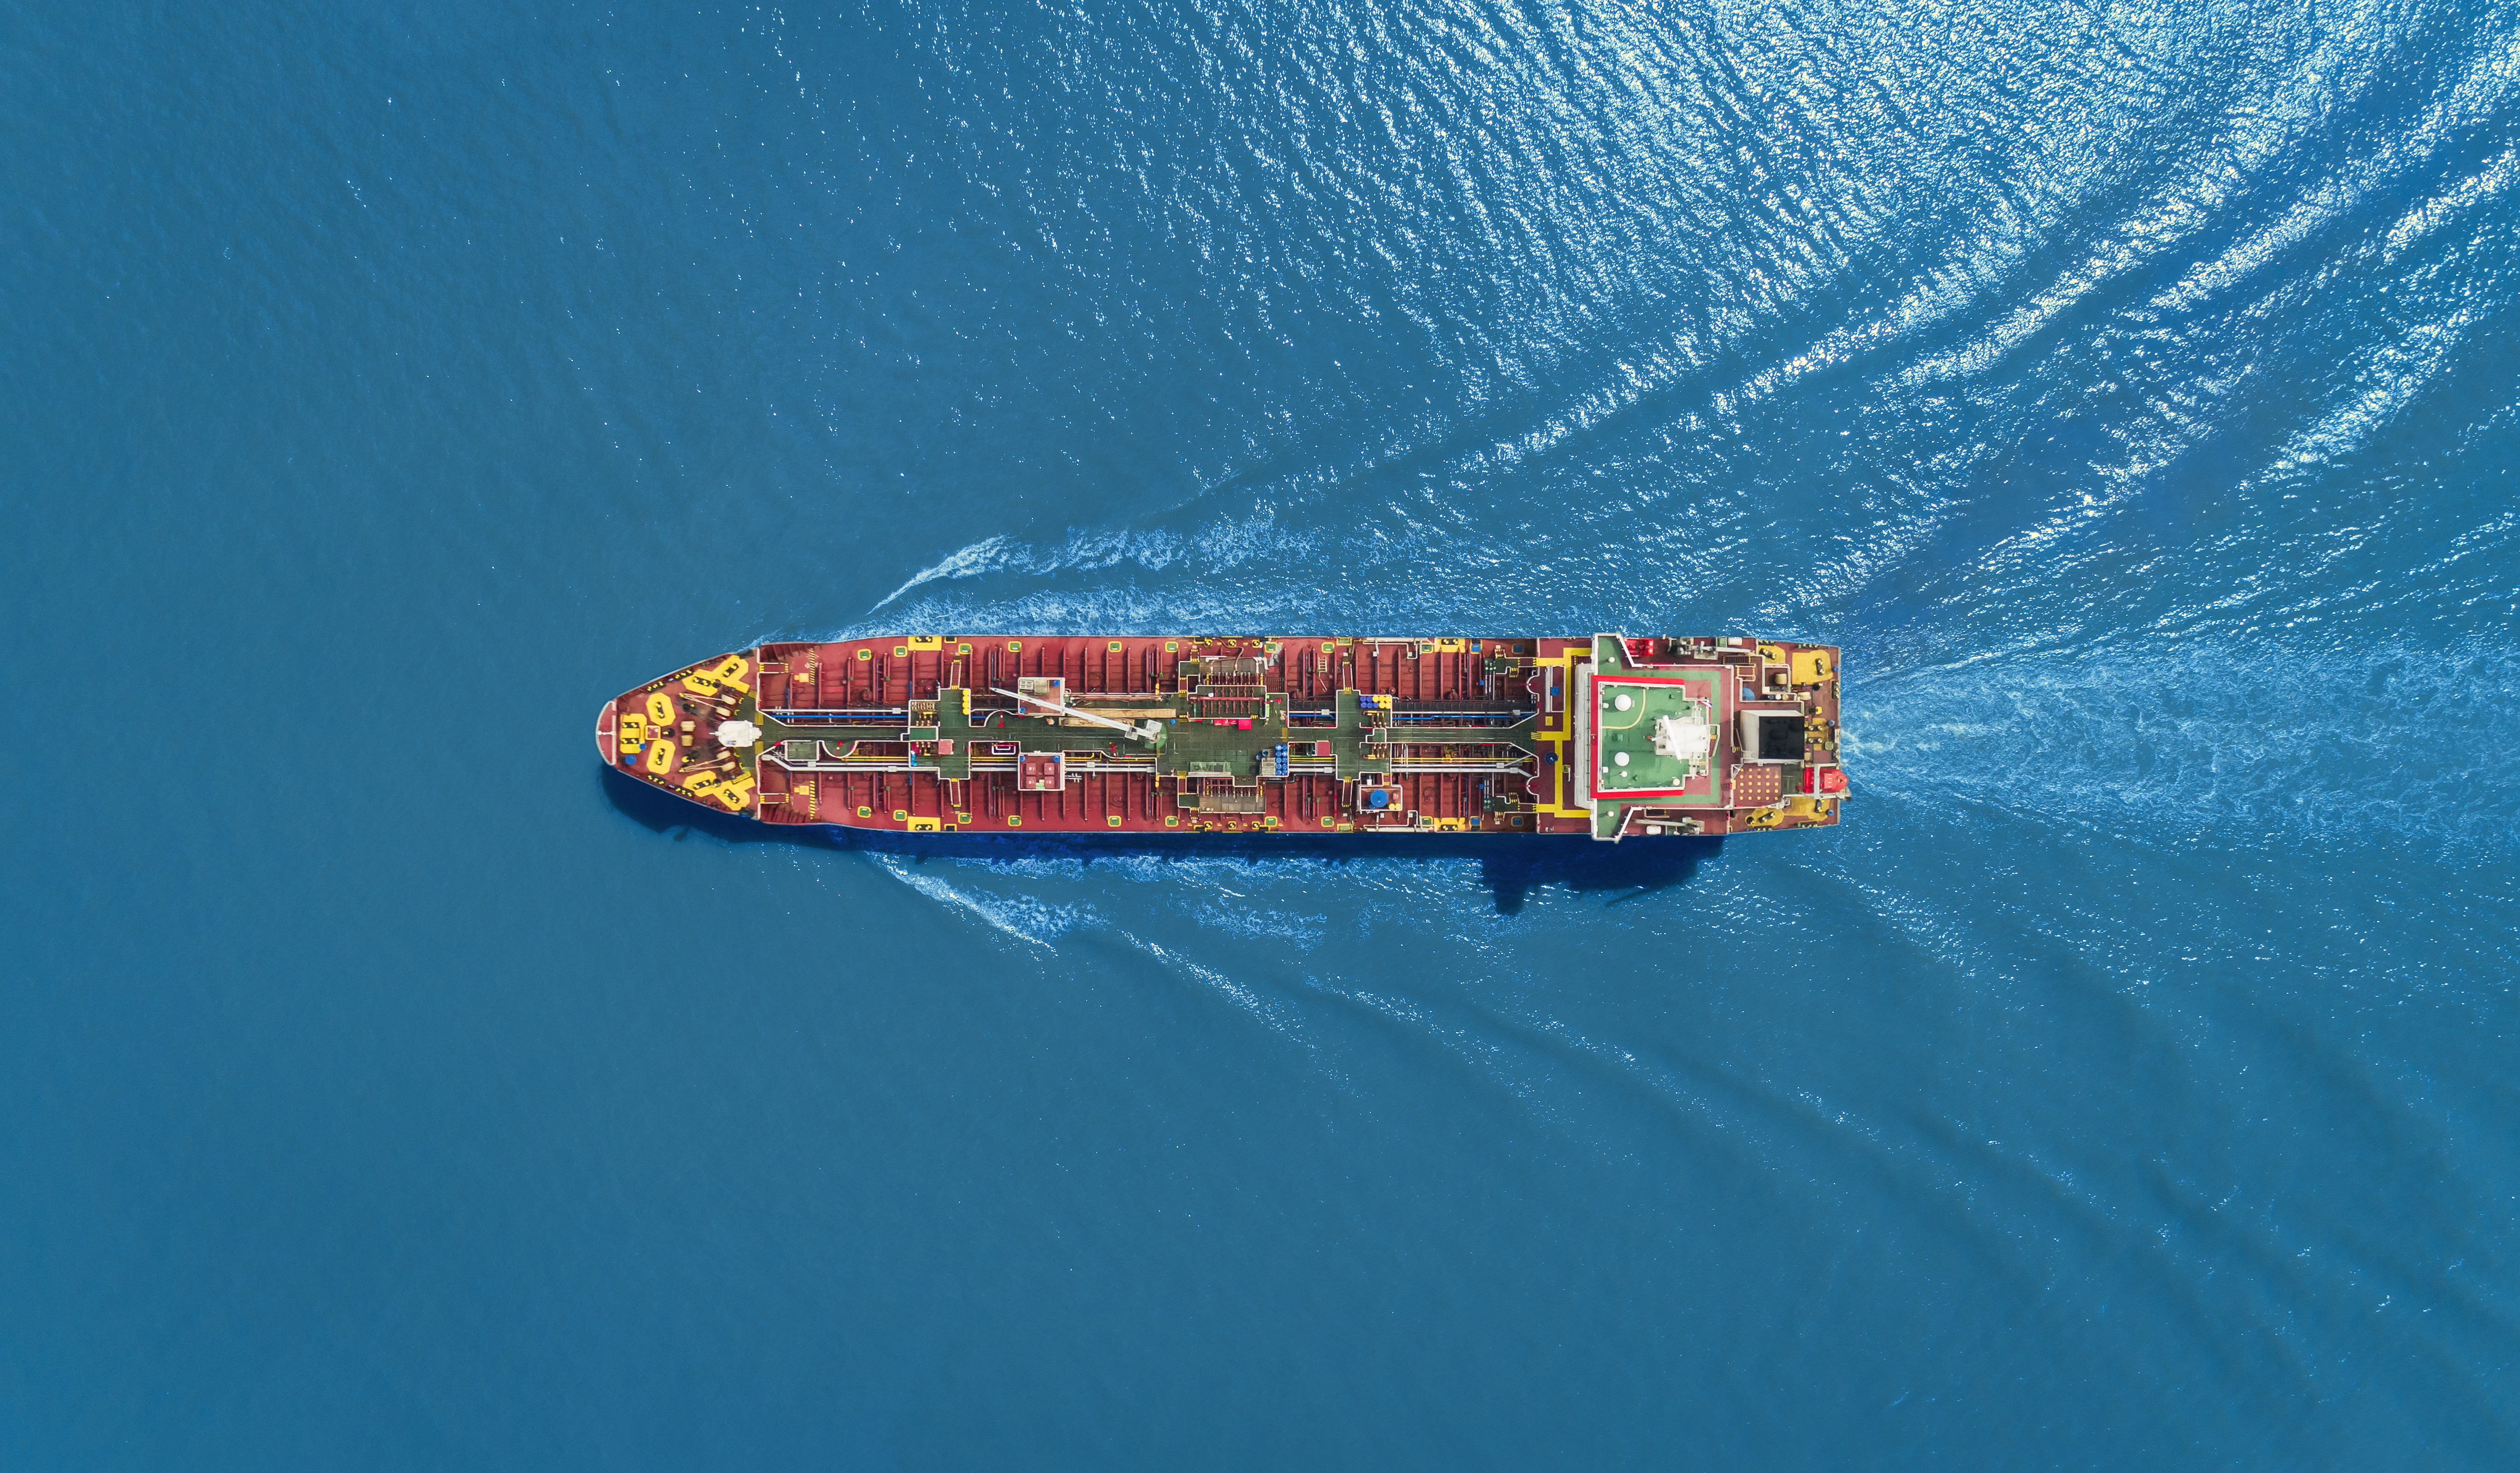
Ongoing attacks on shipping by Houthi militants in the Red Sea have upended seaborne trade through the strategic waterway. Container shipping is taking the biggest hit, with many rerouting via the Cape of Good Hope significantly boosting voyage times and freight cost, while displacing regional marine fuel demand. Read more : Houthis launch biggest ever attack on commercial shipping in Red Sea (subscriber content) View full-size infographic