Carbon Markets: Placing a Value on Emissions and Net-zero Targets

Thought Leadership
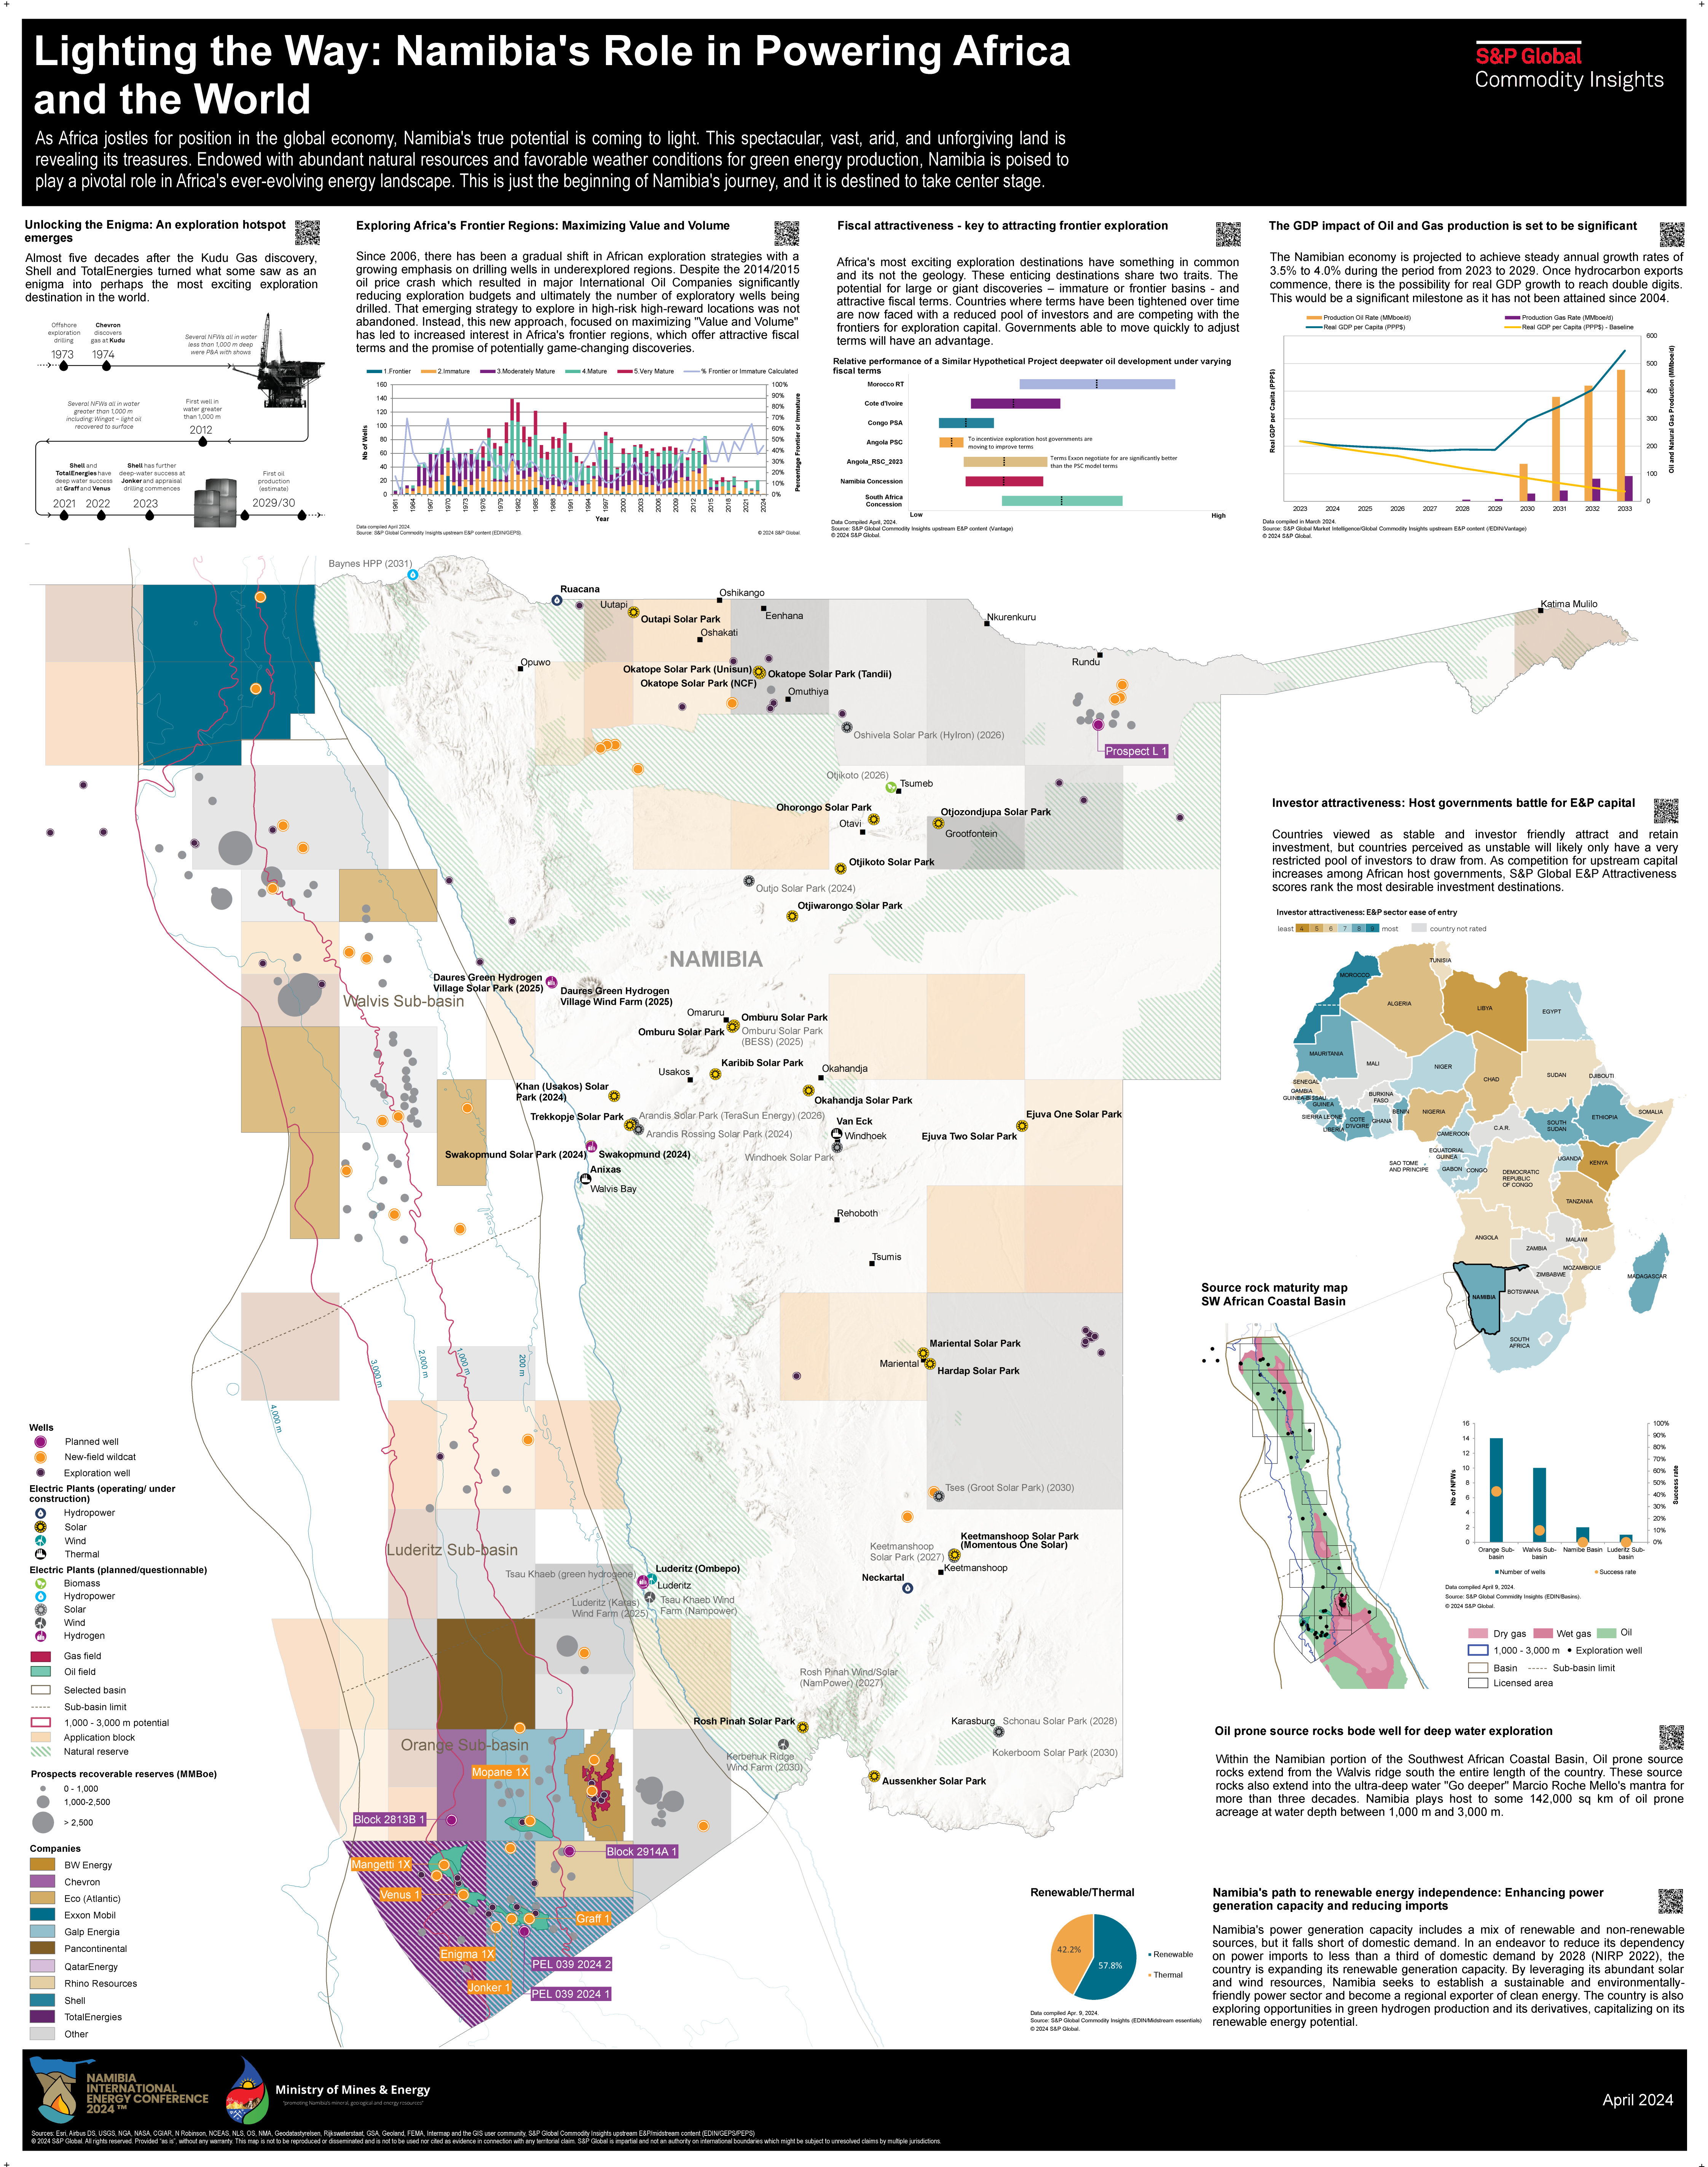
As Africa jostles for position in the global economy, Namibia's true potential is coming to light. This spectacular, vast, arid, and unforgiving land is revealing its treasures. Endowed with abundant natural resources and favorable weather conditions for green energy production, Namibia is poised to play a pivotal role in Africa's ever-evolving energy landscape. This is just the beginning of Namibia's journey, and it is destined to take center stage. The 6th edition of the Namibia International Energy Conference 2024 takes place from 23 – 25 April 2024 in Windhoek, Namibia . Themed ‘ Reimagine Resource-Rich Namibia: Turning Possibilities into Prosperity ,‘ this influential event brings together policymakers, energy stakeholders, investors, and international partners to foster industry growth and position Namibia as a prime investment destination. Convened by RichAfrica Consultancy, the three-day flagship event is held under the patronage of the Ministry of Mines & Energy and in strategic partnership with the African Energy Chamber. S&P Global Commodities Insights in partnership with RichAfrica and the African Energy Chamber will be present at the event delivering insights into Namibia's role in powering Africa and the world. DOWNLOAD INFOGRAPHIC
Thought Leadership
The price wall visualizes 258 of the most important price benchmarks assessed by Platts across various commodities from crude through to chemicals, LNG and carbon. The wall shows the price performance of these benchmarks over 2023 based on their indexed value from the first day of trading. Click on the commodity button to isolate different groups of resources to see which performed best in 2023, a year that saw dramatic changes in trade flows and demand because of sanctions and price caps on Russian commodities and a recovering post-COVID global economy. Isolate individual benchmarks by clicking on the tile to reveal a unique QR code to navigate to specific Platts methodology pages and average price data for 2022 and 2023. Click to start exploring
Thought Leadership
Market values of European wind and solar output plummeted in March as oversupply pulled power prices lower, Platts Renewable Energy Price Explorer shows. Spanish wind and solar capture prices were hit hardest, averaging around Eur12/MWh, according to Platts assessments for S&P Global Commodity Insights. Capture rates fell to 56% for Spanish solar and 60% for Spanish wind, the lowest monthly level on record. Germany, Europe’s biggest market for both wind and solar with 16 TWh generated in March, saw average capture prices fall below Eur60/MWh. Capture rates ranging from 81% for solar to 92% for offshore wind. The Explorer shows the "capture price" renewable energy generators receive based on hourly output and pricing data on a monthly basis. As such capture prices take account of the cannibalization effect caused by Europe's growing fleet of solar and wind farms and are a more accurate reflection of value than average day-ahead wholesale power prices. Elsewhere, Italian capture prices remained highest due to the underlying power price premiums. UK wind captured over 100% of wholesale market values in March averaging above Eur70/MWh. Italian wind and solar values averaged highest, but output was the lowest. Overall, gains for solar were not enough to offset lower wind generation, which fell year on year for the first time since June. The 46 TWh generated by the over 330 GW of wind and solar in the five markets was down 4% on year. For further information, see methodology or contact ci.support@spglobal.com The dial chart shows monthly wind, solar, nuclear, gas and coal-fired generation across Europe's five biggest power markets. Click a segment for more detail.

Thought Leadership
Meet the member. 1. What role do you play or what is your involvement within the team LIVE? I lead our dynamic Ecosystem Marketing team, which is dedicated to positioning us within the right communities to boost visibility, engage with market participants, and ultimately, cultivate both current and future customers. Our mission involves crafting various co-marketing engagement and community growth programs in collaboration with our expanding partner network, including channels, exchanges, strategic partners, influential associations, and our growing digital community on LIVE. Our focus on nurturing a vibrant ecosystem within our sphere is pivotal to our long-term success. 2. Among the elements of LIVE, which one is your favorite and what makes it stand out to you? Conferences on LIVE is one of my personal favorite areas. The synergy between LIVE and events is undeniable—they both revolve around connection, content, and community. Conferences on LIVE provide an ever-present platform for ongoing conversations with our event communities, acting as the glue that binds our key event moments, from Aluminum Symposium to GEA. I'm particularly excited to witness the evolution of this space over time. 3. As we strive towards the goals set for Paris 2050, which future energy development do you perceive as the potential saving grace, and what factors contribute to your belief? Carbon intensity measurement is a key factor in navigating the journey towards cleaner energy systems and achieving the objectives outlined in the Paris Agreement for me. Serving as a GPS for emissions, it illuminates the areas of greatest impact, empowering stakeholders to set smarter goals for emission reduction. This data enables policymakers and businesses to allocate resources effectively, while also shedding light on the environmental impact of different energy sources. With ongoing monitoring, we can stay on course with our emission goals and adjust strategies as needed. Moreover, carbon intensity measurement supports carbon markets, incentivizing cleaner technologies and practices. In essence, carbon intensity measurement serves as the linchpin for realizing the Paris Agreement's objectives, providing insights that drive progress towards a cleaner, greener future. 4. Within your community, what is the trending “hot topic” in discussions or conversations? Undoubtedly, the buzz around CERAWeek 2024 dominates discussions within our community. Bringing together top minds and industry giants, this event serves as a hub for discussing, debating, and collaborating on the most critical issues shaping the future of energy. The excitement surrounding CERAWeek 2024 is palpable and has become the talk of the town. 5. What energy development makes you most excited for the future? While not the most obvious choice, I'm particularly enthusiastic about the impact of derived data for commodity markets using cloud technology. AI gets the limelight, but this advancement presents a range of opportunities for the markets we serve. From making data more accessible and handling big data seamlessly to enabling smarter predictions and bolstering risk management, the potential of derived data with cloud tech is immense. Additionally, the integration of machine learning and AI promises valuable insights, fostering increased transparency and efficiency. Cloud technology's cost-effectiveness for smaller players and resilience further enhance its appeal. Ultimately, I believe that unlocking derived data with cloud tech will revolutionize operations and decision-making in commodity markets, paving the way for a more efficient and resilient future. Daniel Lawson Marketing