Sustainable Aviation Fuel Takes Off


Thought Leadership
The price wall visualizes 258 of the most important price benchmarks assessed by Platts across various commodities from crude through to chemicals, LNG and carbon. The wall shows the price performance of these benchmarks over 2023 based on their indexed value from the first day of trading. Click on the commodity button to isolate different groups of resources to see which performed best in 2023, a year that saw dramatic changes in trade flows and demand because of sanctions and price caps on Russian commodities and a recovering post-COVID global economy. Isolate individual benchmarks by clicking on the tile to reveal a unique QR code to navigate to specific Platts methodology pages and average price data for 2022 and 2023. Click to start exploring

Thought Leadership
Changes in Middle East diesel flows to Europe as Russian products off-limits The Middle East is considered ripe to supply Europe with needed refined products such as diesel to replace Russian products placed under embargo by the EU on Feb. 5 in the wake of Russia’s invasion of Ukraine. The region has several new refineries able to help meet the demand, including Kuwait’s 615,000 b/d Al-Zour refinery and Oman’s 230,000 b/d Duqm plant. Related story: Middle East diesel exports to Europe slump on refinery disruptions, US supplies (Latest update: March 14, 2024)

Thought Leadership
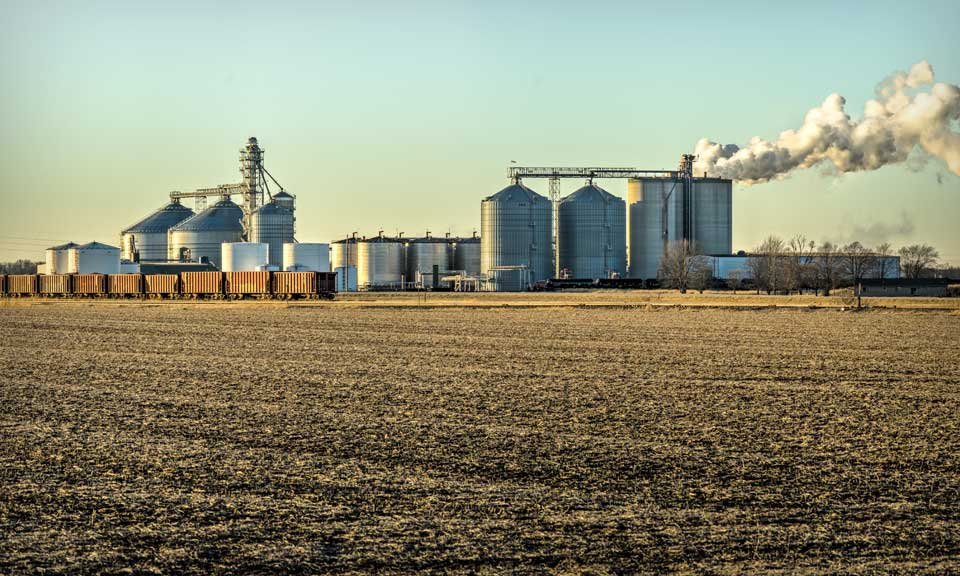
The role of biofuels in energy transition is growing, as they can help decarbonize hard-to-abate transport sectors, but more supply is needed to keep the world on track with net-zero goals. S&P Global Commodity Insights explores how regional policies are driving adoption and evolving technology is widening the feedstock pool, as well as supply and demand outlooks across transport sectors. READ MORE

Thought Leadership
Sumas spot gas down 90.6% year on year CAISO solar generation up 6 points in Dec US West power forwards are trending roughly 50% lower than year-ago packages on weaker gas forwards and above-normal temperatures forecast with El Nino weather conditions to linger into spring. El Nino conditions, which typically occur January through March, tend to bring more rain to the US Southwest and warmer-than-normal temperatures. The three-month outlook indicates a greater probability for above-normal temperatures across most of the Western US, with the exception of the Desert Southwest, according to the US National Weather Service's Climate Prediction Center. SP15 on-peak January rolled off the curve at $55.75/MWh, 79.4% lower than where the 2023 package ended, according to data from Platts, part of S&P Global Commodity Insights. The February package is currently in the low 50s/MWh, 70% below where its 2023 counterpart was a year earlier, while the March package is in the mid-$30s/MWh, 55.4% lower. In gas forwards, SoCal January rolled off the curve at $3.779/MMBtu, 97.9% below where the 2023 contract ended a year earlier, according to S&P Global data. The February contract is currently around $4.063/MMBtu, 78.9% lower than its 2023 counterpart at the same time last year, while the March contract is about $2.816/MMBtu, 63.2% lower. Gas plants burned an average of 1.815 Bcf/d in December to generate an average of 267.167 GWh/d, an analysis of S&P Global data showed. That's down 0.66% from November and a drop of 11.2 % from 2023. S&P Global forecast CAISO's gas fleet to generate around 220 GWh/d in February. In comparison, burning fuel at the same rate as February 2023 would consume 1.758 Bcf/d, a 6% decrease year on year. Spot markets In spot markets, power prices were down significantly from a year ago, when cold weather hit the region and drove up prices. SP15 on-peak day-ahead locational marginal prices averaged $43.49/MWh in December, 83% lower year over year and 11.2% below November prices, according to California Independent System Operator data. Helping pull down power prices, spot gas at SoCal city-gate was down 88.4% year on year and 40% lower month on month at an average of $3.554/MMBtu in December, according to S&P Global data. In the Northwest, Sumas spot gas was down 90.6% year on year at an average of $2.669/MMBtu. The decline in spot gas prices likely accounts for the lower average spot power prices month on month in December, said Morris Greenberg, senior manager with the low-carbon electricity team at S&P Global. Compared to a year earlier, CAISO population-weighted temperatures averaged 8% higher in December, resulting in 38.4% fewer heating-degree days, according to CustomWeather data. Fuel mix Thermal generation remained the lead fuel source at 46.1% of the total fuel mix in December, little changed year on year, while solar generation was up nearly 6 percentage points to average 14.7% of the mix, according to CAISO data. Hydropower remained strong, averaging 8% of the December fuel mix, 2 points higher than a year earlier. Total generation was down nearly 8% from a year earlier at an average of roughly 23.4 GWh/day, as peakload slipped 2% year on year to average 27.254 GW in December, according to CAISO data. In the Northwest, peakload dropped nearly 11% year on year to average 7.89 GW in December, according to Bonneville Power Administration data. Hydropower remained the lead fuel source at nearly 74% of the mix, followed by nuclear at 12.3%, thermal at 9.6% and wind at 4.3%. Following El Nino expectations of the Northwest for warmer temperatures and drier precipitation, BPA population-weighted temperatures in December were 10% above normal and 21.5% higher than a year earlier, leading to 27% fewer heating-degrees days year on year, according to CustomWeather data.