The Singapore low sulfur fuel oil supply is expected to remain tight in the April 11-15 trading week as higher gasoil crack spread continuously draws LSFO blending components to the middle distillate market.
The high sulfur fuel oil market is also likely to stay strong in the week due to a decline in an inflow of the Middle Eastern cargoes into Asia after the Russia-Ukraine conflict.
Crude oil futures opened lower in Asia April 11, with June ICE Brent trading at $100.47/b at 0300 GMT, down $1.11/b from the 0830 GMT Asian close April 8.
** Singapore Marine Fuel 0.5%S May-June swap spread weakened in April from March. The front-end time spread averaged $21.29/mt over April 1-8, down from $30.42/mt in March, S&P Global Commodity Insights data showed. Market sources said supply would stay tight despite weaker time spread as sulfur and viscosity cutter stocks, such as vacuum gasoil and light cycle oil are taken by the gasoil market as the gasoil crack spread has been strong, fuel oil traders said. The time spread has weakened following Brent swaps while the front-end May-June spread averaged $1.27/b over April 1-8, down from $3.33/b in March.
** Market optimism in the downstream bunker market stemmed from a less-than-ample availability of finished grade product, especially for delivery on a prompt basis; only a few suppliers were still in a position to offer product to the spot market for delivery less than around 10 days, traders said.
** The delivered market was pricing higher on account of a rising replacement cost for bunker sellers due to a firming upstream market, traders said. The premium for Singapore-delivered marine fuel 0.5%S bunker over the benchmark upstream Singapore marine fuel 0.5% cargo assessment averaged $29.92/mt in the week ended April 8, up from the previous week's average of $23.65/mt, S&P Global data showed.
** Market volatility is still likely to cap demand for Singapore-delivered marine fuel 0.5%S, whereas stockpiles in the downstream market was heard balanced against demand, according to local bunker suppliers.
** In Fujairah, a tight prompt availability situation coupled with limited slots available for scheduling barge delivery of IMO-compliant product on a prompt basis to the spot market was likely to help set a floor for Fujairah-delivered marine fuel 0.5%S bunker premium.
** Uptick in LSFO bunker demand is likely to drawdown inventories at the port of Hong Kong for the rest of April, following the easing of quarantine measures for bunker-only calls since April 1, bunker suppliers said.
** Traders anticipate LSFO bunker inventory shortfalls in Japan to prolong despite the resumption of loadings for smaller parcels expected during the week started April 11 at Idemitsu and ENEOS refineries.
** Steady downstream demand for Zhoushan-delivered marine fuel 0.5%S amid limited availability of the ex-wharf grade is expected to buoy premiums, according to market sources.
** Both 180 CST and 380 CST grades are expected to remain tight as US refiners increasingly take HSFO from the Middle East as they are no longer buying Russian fuel oil.
** The 180 CST grade is tight in particular as demand from South Asia has been surging. As a result, the Singapore 180 CST cash differential to MOPS strip rose to $31.66/mt on April 8, the highest since Nov. 5, 2019, when it stood at $34.66/mt, S&P Global data showed. The 180 CST-380 CST spread hit an all-time high for three days in a row to rise to $56.75/mt on April 8, S&P Global data showed.
** The prevailing concerns around contaminated fuel at the city-state were also limiting the number of suppliers to source the product from, bunker traders said. Tight prompt availability has meant that the earliest that most suppliers are able to offer product to the spot market is around 10 days forward.
** This in turn was likely to have a cascading effect on Singapore-delivered 380 CST high sulfur bunker premium, which has indeed sky-rocketed in the recent days. The premium for Singapore-delivered 380 CST high sulfur bunker over Singapore 380 CST HSFO cargo, which averaged $33.88/mt in the week ended April 8, was up from the previous week's average of $23.83/mt, and stood at a near two-year high $36.67/mt on April 8, S&P Global data showed.
** Amid above-average volumes of fixtures since April, bunker suppliers expect rising upstream availability of HSFO cargoes in Hong Kong to supply the strengthening downstream demand.
** The recent diversion of inquiries for delivered HSFO to South Korea is expected to lift bunker demand while stockpiles remain ample, as buyers were heard skipping bunker-only calls in Singapore amid quality concerns.

News
India's unwavering appetite for Russian crude has provided ample bandwidth to Middle Eastern sour crude suppliers to cater to the needs of South Korea, Japan, Thailand and other East Asian buyers. Even if OPEC+ decides to extend production cuts, East Asian refiners are confident they can secure adequate Middle East sour crude term supplies. View full-size infographic Also listen:
News
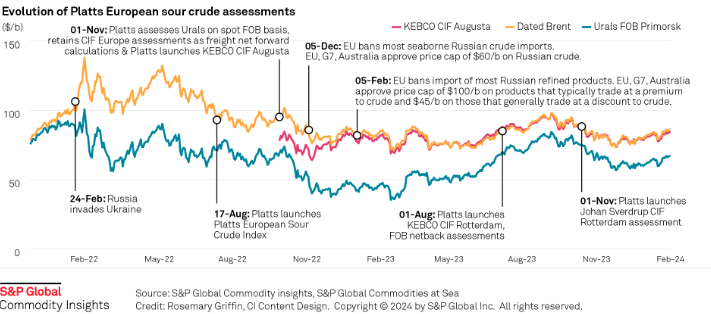
Russia's invasion of Ukraine has had a profound impact on sour crude export destinations, and increased the appetite for sweet crudes among European refiners. Platts methodology has evolved to reflect this changing landscape. Click here to see the full-size infographic.

News
Latest update: Jan. 30, 2024 A key OPEC+ advisory committee, co-chaired by Saudi Arabia and Russia, is set to meet online Feb. 1, with crude prices still stuck below the level that many of the alliance’s major producers need to balance their budgets. Traders will be seeking signals from the Joint Ministerial Monitoring Committee meeting on how long the bloc will keep the reins on its production and how it sees supply-demand fundamentals shaping up in the months ahead. Related story: OPEC+ monitoring committee prepares to meet as group battles sticky oil prices (Subscriber content) Click here to view the full-size infographic Compare hundreds of different crude grades and varieties produced around the world with Platts interactive Periodic Table of Oil .

News
Sumas spot gas down 90.6% year on year CAISO solar generation up 6 points in Dec US West power forwards are trending roughly 50% lower than year-ago packages on weaker gas forwards and above-normal temperatures forecast with El Nino weather conditions to linger into spring. El Nino conditions, which typically occur January through March, tend to bring more rain to the US Southwest and warmer-than-normal temperatures. The three-month outlook indicates a greater probability for above-normal temperatures across most of the Western US, with the exception of the Desert Southwest, according to the US National Weather Service's Climate Prediction Center. SP15 on-peak January rolled off the curve at $55.75/MWh, 79.4% lower than where the 2023 package ended, according to data from Platts, part of S&P Global Commodity Insights. The February package is currently in the low 50s/MWh, 70% below where its 2023 counterpart was a year earlier, while the March package is in the mid-$30s/MWh, 55.4% lower. In gas forwards, SoCal January rolled off the curve at $3.779/MMBtu, 97.9% below where the 2023 contract ended a year earlier, according to S&P Global data. The February contract is currently around $4.063/MMBtu, 78.9% lower than its 2023 counterpart at the same time last year, while the March contract is about $2.816/MMBtu, 63.2% lower. Gas plants burned an average of 1.815 Bcf/d in December to generate an average of 267.167 GWh/d, an analysis of S&P Global data showed. That's down 0.66% from November and a drop of 11.2 % from 2023. S&P Global forecast CAISO's gas fleet to generate around 220 GWh/d in February. In comparison, burning fuel at the same rate as February 2023 would consume 1.758 Bcf/d, a 6% decrease year on year. Spot markets In spot markets, power prices were down significantly from a year ago, when cold weather hit the region and drove up prices. SP15 on-peak day-ahead locational marginal prices averaged $43.49/MWh in December, 83% lower year over year and 11.2% below November prices, according to California Independent System Operator data. Helping pull down power prices, spot gas at SoCal city-gate was down 88.4% year on year and 40% lower month on month at an average of $3.554/MMBtu in December, according to S&P Global data. In the Northwest, Sumas spot gas was down 90.6% year on year at an average of $2.669/MMBtu. The decline in spot gas prices likely accounts for the lower average spot power prices month on month in December, said Morris Greenberg, senior manager with the low-carbon electricity team at S&P Global. Compared to a year earlier, CAISO population-weighted temperatures averaged 8% higher in December, resulting in 38.4% fewer heating-degree days, according to CustomWeather data. Fuel mix Thermal generation remained the lead fuel source at 46.1% of the total fuel mix in December, little changed year on year, while solar generation was up nearly 6 percentage points to average 14.7% of the mix, according to CAISO data. Hydropower remained strong, averaging 8% of the December fuel mix, 2 points higher than a year earlier. Total generation was down nearly 8% from a year earlier at an average of roughly 23.4 GWh/day, as peakload slipped 2% year on year to average 27.254 GW in December, according to CAISO data. In the Northwest, peakload dropped nearly 11% year on year to average 7.89 GW in December, according to Bonneville Power Administration data. Hydropower remained the lead fuel source at nearly 74% of the mix, followed by nuclear at 12.3%, thermal at 9.6% and wind at 4.3%. Following El Nino expectations of the Northwest for warmer temperatures and drier precipitation, BPA population-weighted temperatures in December were 10% above normal and 21.5% higher than a year earlier, leading to 27% fewer heating-degrees days year on year, according to CustomWeather data.