CHINA DATA: Gasoline, gasoil, jet fuel exports slump 53% on year in Q1

China's gasoil, gasoline and jet fuel exports fell 52.7% in the first quarter from the same period of 2021, amid a steep reduction in export quota allocations, data released April 18 by the General Administration of Customs showed.
Combined exports of the three key oil products amounted to 6.12 million mt, accounting for 47% of the total quotas allocated in the first batch for 2022, leaving 6.88 million mt available.
Beijing is set to cut the country's oil product exports by slashing gasoline, gasoil and jet export allocations in the first batch of quotas for 2022 by 56% year on year to 13 million mt.
The remaining quotas are likely to only sustain for a quarter if the outflows are stable from current levels, analysts said.
"We haven't heard that there will be a second batch of export quota allocation yet," a source with Norinco's Huajin refinery said. The refinery in Q1 has used up its quotas of 150,000 mt that were allocated in the first batch.
Meanwhile, refinery sources from PetroChina and Sinopec revealed that they have limited quotas left and have still been waiting for further notice on quota allocations for the next round.
A senior economist with Sinopec called for increasing quota allocation to offset stock pressure on refineries as domestic demand falls, with Beijing's zero-tolerance approach to controlling the coronavirus slowing economic activities and mobility.
S&P Global Commodity Insights' Platts Analytics expects China to witness oil demand destruction of over 1 million b/d in both March and April, and nearly 600,000 b/d in May from its original forecast due to the movement curbs.
In the report dated March 16, it reduced the demand forecast by 650,000 b/d for March and 400,000 b/d for April. "The main loss was attributed to gasoline and jet fuel due to the travel suspension," Platts Analytics said in the report.
Due to limited quota availability, exports in Q2 are more or less stable from Q1, forcing refineries to cut throughput amid high feedstock costs.
In March, the country's gasoil exports jumped 239.8% to a six-month high of 670,000 mt in March from a multi-year low of 197,000 mt in February, reflecting weak demand in the domestic market.
With export margins becoming more attractive in March, China's oil companies have adjusted their export plans from around 500,000 mt initially, and sent more gasoil cargoes abroad, according to refinery sources.
However, overall gasoil exports in the first quarter remained 82.7% lower at 1.08 million mt compared to 6.2 million mt a year ago, GAC data showed.

Meanwhile, gasoline exports rebounded to a nine-month high of 1.16 million mt in March, which was more than double the initial estimation of about 550,000 mt, the data showed.
Demand for gasoline has been mostly hit by movement controls and high product prices, a refinery source said, adding that stocks of gasoline were the highest among all oil products.
Market sources estimate China's gasoline exports in April to be at 1 million-1.1 million mt. But due to quota shortage, gasoline exports of 3.05 million mt in Q1 remained 40.2% below the level in the same month in 2021.
Jet fuel was the only product to witness a year-on-year increase in exports amid muted domestic consumption because of COVID-19-related controls and resurgent demand for international flights overseas. Outflows in March rose 7.2% year on year to 770,000 mt in March, and jumped 25.2% to 1.99 million mt in Q1, according to GAC data.
China's key oil products exports ('000 mt)
Source: General Administration of Customs
Notes: * was adjusted according to the % change provided by the GAC

News
India's unwavering appetite for Russian crude has provided ample bandwidth to Middle Eastern sour crude suppliers to cater to the needs of South Korea, Japan, Thailand and other East Asian buyers. Even if OPEC+ decides to extend production cuts, East Asian refiners are confident they can secure adequate Middle East sour crude term supplies. View full-size infographic Also listen:
News
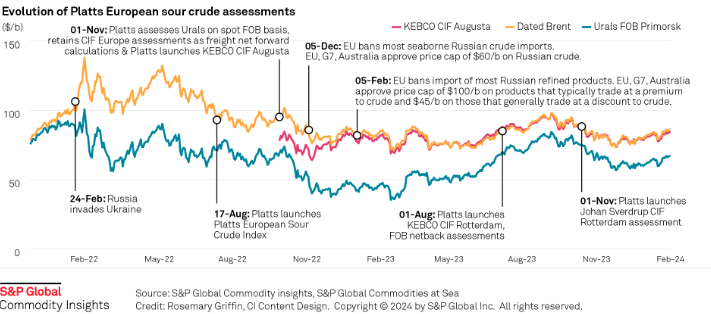
Russia's invasion of Ukraine has had a profound impact on sour crude export destinations, and increased the appetite for sweet crudes among European refiners. Platts methodology has evolved to reflect this changing landscape. Click here to see the full-size infographic.

News
Latest update: Jan. 30, 2024 A key OPEC+ advisory committee, co-chaired by Saudi Arabia and Russia, is set to meet online Feb. 1, with crude prices still stuck below the level that many of the alliance’s major producers need to balance their budgets. Traders will be seeking signals from the Joint Ministerial Monitoring Committee meeting on how long the bloc will keep the reins on its production and how it sees supply-demand fundamentals shaping up in the months ahead. Related story: OPEC+ monitoring committee prepares to meet as group battles sticky oil prices (Subscriber content) Click here to view the full-size infographic Compare hundreds of different crude grades and varieties produced around the world with Platts interactive Periodic Table of Oil .

News
Sumas spot gas down 90.6% year on year CAISO solar generation up 6 points in Dec US West power forwards are trending roughly 50% lower than year-ago packages on weaker gas forwards and above-normal temperatures forecast with El Nino weather conditions to linger into spring. El Nino conditions, which typically occur January through March, tend to bring more rain to the US Southwest and warmer-than-normal temperatures. The three-month outlook indicates a greater probability for above-normal temperatures across most of the Western US, with the exception of the Desert Southwest, according to the US National Weather Service's Climate Prediction Center. SP15 on-peak January rolled off the curve at $55.75/MWh, 79.4% lower than where the 2023 package ended, according to data from Platts, part of S&P Global Commodity Insights. The February package is currently in the low 50s/MWh, 70% below where its 2023 counterpart was a year earlier, while the March package is in the mid-$30s/MWh, 55.4% lower. In gas forwards, SoCal January rolled off the curve at $3.779/MMBtu, 97.9% below where the 2023 contract ended a year earlier, according to S&P Global data. The February contract is currently around $4.063/MMBtu, 78.9% lower than its 2023 counterpart at the same time last year, while the March contract is about $2.816/MMBtu, 63.2% lower. Gas plants burned an average of 1.815 Bcf/d in December to generate an average of 267.167 GWh/d, an analysis of S&P Global data showed. That's down 0.66% from November and a drop of 11.2 % from 2023. S&P Global forecast CAISO's gas fleet to generate around 220 GWh/d in February. In comparison, burning fuel at the same rate as February 2023 would consume 1.758 Bcf/d, a 6% decrease year on year. Spot markets In spot markets, power prices were down significantly from a year ago, when cold weather hit the region and drove up prices. SP15 on-peak day-ahead locational marginal prices averaged $43.49/MWh in December, 83% lower year over year and 11.2% below November prices, according to California Independent System Operator data. Helping pull down power prices, spot gas at SoCal city-gate was down 88.4% year on year and 40% lower month on month at an average of $3.554/MMBtu in December, according to S&P Global data. In the Northwest, Sumas spot gas was down 90.6% year on year at an average of $2.669/MMBtu. The decline in spot gas prices likely accounts for the lower average spot power prices month on month in December, said Morris Greenberg, senior manager with the low-carbon electricity team at S&P Global. Compared to a year earlier, CAISO population-weighted temperatures averaged 8% higher in December, resulting in 38.4% fewer heating-degree days, according to CustomWeather data. Fuel mix Thermal generation remained the lead fuel source at 46.1% of the total fuel mix in December, little changed year on year, while solar generation was up nearly 6 percentage points to average 14.7% of the mix, according to CAISO data. Hydropower remained strong, averaging 8% of the December fuel mix, 2 points higher than a year earlier. Total generation was down nearly 8% from a year earlier at an average of roughly 23.4 GWh/day, as peakload slipped 2% year on year to average 27.254 GW in December, according to CAISO data. In the Northwest, peakload dropped nearly 11% year on year to average 7.89 GW in December, according to Bonneville Power Administration data. Hydropower remained the lead fuel source at nearly 74% of the mix, followed by nuclear at 12.3%, thermal at 9.6% and wind at 4.3%. Following El Nino expectations of the Northwest for warmer temperatures and drier precipitation, BPA population-weighted temperatures in December were 10% above normal and 21.5% higher than a year earlier, leading to 27% fewer heating-degrees days year on year, according to CustomWeather data.