South Korea maintains robust crude import trend as refiners cheer lucrative product cracks

South Korea is undeterred by surging crude prices and the world's fourth biggest crude importer aims to actively secure ample refinery feedstocks as local refiners maintain relatively high run rates to capture lucrative Asian refining margins, industry and market participants said over April 18-21.
South Korea received 11.472 million mt, or 84.09 million barrels, of crude oil in March, up 16.9% from 71.92 million barrels imported a year earlier, latest data from Korea Customs Service showed.
The March shipments were also up 6.1% from 79.28 million barrels imported in February, while crude imports during the first three months increased 15.4% year on year to 258.17 million barrels, the customs data showed.
The country's crude imports are likely to maintain the upward momentum over the coming months as local refiners actively conduct spot crude purchases on top of their term supply contracts in an effort to maintain high throughput and run rates, with the primary goal of capturing robust regional refining margins and expanding oil product export opportunities.
Second-month Singapore gasoil swap crack against Dubai swaps averaged $27.80/b to-date in April, compared with the first-quarter average crack spread of $19/b and the 2021 average of $9.60/b.

Global crude supply is tight but oil product supply is even tighter, making an ideal market condition for highly sophisticated South Korean refineries capable of maximizing high-end fuel output and sales, according to middle distillate marketers at major South Korean refiners including S-Oil and SK Innovation.
Local refiners and condensate splitters processed 79.85 million barrels, or 2.58 million b/d, of crude in February, up 8.7% from 73.48 million barrels a year earlier, rising for the seventh straight month, latest data from state-run Korea National Oil Corp showed.
Refining margins are running high as various financial sanctions against Moscow are limiting Russian oil product trades, while Chinese fuel production and exports are low amid lockdowns in the country's major cities, one refinery official said, indicating that margins for diesel and jet fuel in particular are outperforming due to rapidly improving people mobility across Asia and Oceania.
Russian products are scarce and the sharp decline in Chinese middle distillate supply in the regional market is a boon for South Korean transportation fuel exporters, the middle distillate marketers said.
China's gasoil, gasoline and jet fuel exports tumbled 52.7% in the first quarter from the same period of 2021, amid a steep reduction in export quota allocations, S&P Global Commodity Insights reported previously, citing latest data from General Administration of Customs.
In addition, China's crude throughput fell 1.5% year on year to 13.96 million b/d in the first quarter due to the dual blow of war-led lofty global oil prices as well as lockdowns imposed as a result of fresh outbreaks of COVID-19, S&P Global reported previously.
South Korea's petroleum product sales to Australia are expected to reach a multi-year high in first-half 2022 as the Oceania fuel importer heavily favors South Korean products over Chinese supply as trade and geopolitical tensions between Canberra and Beijing persist, according to refinery sources in Seoul and fuel distribution managers in Sydney and Brisbane.
South Korea is estimated to have exported around 13.6 million barrels of oil products to Australia in Q1, up 77% from a year earlier and the highest sales volume in the quarter since 15.7 million barrels were exported during the first three months in 2017, according to marketing information gathered from major South Korean refiners by S&P Global and latest data from KNOC.

Australian fuel import and distribution companies have been enquiring for incremental cargoes from South Korean refiners and fuel traders in recent few trading cycles as the sharp reduction in China's fuel export quotas and most importantly the prolonged Canberra-Beijing tensions prompt Australia to heavily favor its close economic and geopolitical ally South Korea, according to the refinery middle distillate marketers.
In 2021, South Korea and Australia upgraded their bilateral relationship to a comprehensive strategic partnership.
Tensions between Canberra and Beijing have once again escalated in recent weeks, after China signed a security pact with the Solomon Islands in a move that could see China establishing a military base in close proximity to Australia's mainland.
The customs data showed South Korea's import of US crude in March, mostly light sweet grades, slipped 3% from a year earlier to 10.87 million barrels. However, South Korean refiners combined have been receiving at least five VLCCs of US crude every month since June 2020, with the exception of December 2021.
South Korea's crude imports from its top supplier Saudi Arabia, except shipments from the Saudi-Kuwaiti Neutral Zone, jumped 66.2% year on year to 31.02 million barrels in March, the customs data showed.
KNOC will release detailed oil trade data for March, including crude imports from Russia, in the week of April 24.
South Korea's monthly crude imports (Unit: million barrels)
Source: Korea Customs Service, Korea National Oil Corp.
News
India's unwavering appetite for Russian crude has provided ample bandwidth to Middle Eastern sour crude suppliers to cater to the needs of South Korea, Japan, Thailand and other East Asian buyers. Even if OPEC+ decides to extend production cuts, East Asian refiners are confident they can secure adequate Middle East sour crude term supplies. View full-size infographic Also listen:
News
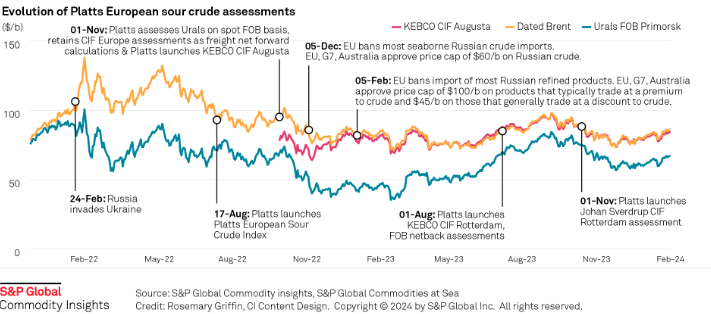
Russia's invasion of Ukraine has had a profound impact on sour crude export destinations, and increased the appetite for sweet crudes among European refiners. Platts methodology has evolved to reflect this changing landscape. Click here to see the full-size infographic.

News
Latest update: Jan. 30, 2024 A key OPEC+ advisory committee, co-chaired by Saudi Arabia and Russia, is set to meet online Feb. 1, with crude prices still stuck below the level that many of the alliance’s major producers need to balance their budgets. Traders will be seeking signals from the Joint Ministerial Monitoring Committee meeting on how long the bloc will keep the reins on its production and how it sees supply-demand fundamentals shaping up in the months ahead. Related story: OPEC+ monitoring committee prepares to meet as group battles sticky oil prices (Subscriber content) Click here to view the full-size infographic Compare hundreds of different crude grades and varieties produced around the world with Platts interactive Periodic Table of Oil .

News
Sumas spot gas down 90.6% year on year CAISO solar generation up 6 points in Dec US West power forwards are trending roughly 50% lower than year-ago packages on weaker gas forwards and above-normal temperatures forecast with El Nino weather conditions to linger into spring. El Nino conditions, which typically occur January through March, tend to bring more rain to the US Southwest and warmer-than-normal temperatures. The three-month outlook indicates a greater probability for above-normal temperatures across most of the Western US, with the exception of the Desert Southwest, according to the US National Weather Service's Climate Prediction Center. SP15 on-peak January rolled off the curve at $55.75/MWh, 79.4% lower than where the 2023 package ended, according to data from Platts, part of S&P Global Commodity Insights. The February package is currently in the low 50s/MWh, 70% below where its 2023 counterpart was a year earlier, while the March package is in the mid-$30s/MWh, 55.4% lower. In gas forwards, SoCal January rolled off the curve at $3.779/MMBtu, 97.9% below where the 2023 contract ended a year earlier, according to S&P Global data. The February contract is currently around $4.063/MMBtu, 78.9% lower than its 2023 counterpart at the same time last year, while the March contract is about $2.816/MMBtu, 63.2% lower. Gas plants burned an average of 1.815 Bcf/d in December to generate an average of 267.167 GWh/d, an analysis of S&P Global data showed. That's down 0.66% from November and a drop of 11.2 % from 2023. S&P Global forecast CAISO's gas fleet to generate around 220 GWh/d in February. In comparison, burning fuel at the same rate as February 2023 would consume 1.758 Bcf/d, a 6% decrease year on year. Spot markets In spot markets, power prices were down significantly from a year ago, when cold weather hit the region and drove up prices. SP15 on-peak day-ahead locational marginal prices averaged $43.49/MWh in December, 83% lower year over year and 11.2% below November prices, according to California Independent System Operator data. Helping pull down power prices, spot gas at SoCal city-gate was down 88.4% year on year and 40% lower month on month at an average of $3.554/MMBtu in December, according to S&P Global data. In the Northwest, Sumas spot gas was down 90.6% year on year at an average of $2.669/MMBtu. The decline in spot gas prices likely accounts for the lower average spot power prices month on month in December, said Morris Greenberg, senior manager with the low-carbon electricity team at S&P Global. Compared to a year earlier, CAISO population-weighted temperatures averaged 8% higher in December, resulting in 38.4% fewer heating-degree days, according to CustomWeather data. Fuel mix Thermal generation remained the lead fuel source at 46.1% of the total fuel mix in December, little changed year on year, while solar generation was up nearly 6 percentage points to average 14.7% of the mix, according to CAISO data. Hydropower remained strong, averaging 8% of the December fuel mix, 2 points higher than a year earlier. Total generation was down nearly 8% from a year earlier at an average of roughly 23.4 GWh/day, as peakload slipped 2% year on year to average 27.254 GW in December, according to CAISO data. In the Northwest, peakload dropped nearly 11% year on year to average 7.89 GW in December, according to Bonneville Power Administration data. Hydropower remained the lead fuel source at nearly 74% of the mix, followed by nuclear at 12.3%, thermal at 9.6% and wind at 4.3%. Following El Nino expectations of the Northwest for warmer temperatures and drier precipitation, BPA population-weighted temperatures in December were 10% above normal and 21.5% higher than a year earlier, leading to 27% fewer heating-degrees days year on year, according to CustomWeather data.